Urban mobility solutions: Calibrating digital twins at scale
February 10, 2025
Carolina Osorio, Staff Research Scientist, Google Research, and Professor, HEC Montreal, and Chao Zhang, Research Scientist, Google Research
We develop a scalable and improved high-resolution metropolitan traffic simulator that uses path travel time data to simulate traffic across metropolitan highway networks.
Quick links
In recent years, machine learning has enabled tremendous advances in urban planning and traffic management. However, as transportation systems become increasingly complex, due to factors like increased traveler and vehicle connectivity and the evolution of new services (e.g., ride-sharing, car-sharing, on-demand transit), finding solutions continues to be difficult. To better understand these challenges, cities are developing high-resolution urban mobility simulators, called “digital twins”, that can provide detailed descriptions of congestion patterns. These systems incorporate a variety of factors that might influence traffic flow, such as available mobility services, including on-demand rider-to-vehicle matching for ride-sharing services; network supply operations, such as traffic-responsive tolling or signal control; and sets of diverse traveler behaviors that govern driving style (e.g., risk-averse vs. aggressive), route preferences, and travel mode choices.
These simulators tackle a variety of use cases, such as the deployment of electric-vehicle charging stations, post-event traffic mitigation, congestion pricing and tolling, sustainable traffic signal control, and public transportation expansions. However, it remains a challenge to estimate the inputs of these simulators, such as spatial and temporal distribution of travel demand, road attributes (e.g., number of lanes and geometry), prevailing traffic signal timings, etc., so that they can reliably replicate prevailing traffic patterns of congested, metropolitan-scale networks. The process of estimating these inputs is known as calibration.
The main goal of simulation calibration is to bridge the gap between simulated and observed traffic data. In other words, a well-calibrated simulator yields simulated congestion patterns that accurately reflect those observed in the field. Demand calibration (i.e., determining the demand for or popularity of a particular origin-to-destination trip) is the most important input to estimate, but also the most difficult. Traditionally, simulators have been calibrated using traffic sensors installed under the roadway. These sensors are present in most cities but costly to install and maintain. Also, their spatial sparsity limits the calibration quality because congestion patterns go largely unobserved. Moreover, most of the demand calibration work is based on single, typically small, road networks (e.g., an arterial).
In “Traffic Simulations: Multi-City Calibration of Metropolitan Highway Networks”, we showcase the ability to calibrate demand for the full metropolitan highway networks of six cities — Seattle, Denver, Philadelphia, Boston, Orlando, and Salt Lake City — for all congestion levels, from free-flowing to highly congested. To calibrate, we use non-sparse traffic data, namely aggregated and anonymized path travel times, yielding more accurate and reliable models. When compared to a standard benchmark, the proposed approach is able to replicate historical travel time data 44% better on average (and as much as 80% better in some cases).
Calibration approach
To calibrate travel demand, urban planners and traffic operators partition metropolitan areas into zones and use simulators to estimate travel demand between pairs of zones. However, high-resolution traffic simulators can be compute-costly to use. Our solution takes advantage of recent research into sample-efficient algorithms that tackle the optimization problems in a computationally fast way, avoiding the need for large samples from a costly simulator. In particular, we use metamodel methods, which leverage low-resolution, physics-informed traffic models to guide the search in the optimization process.
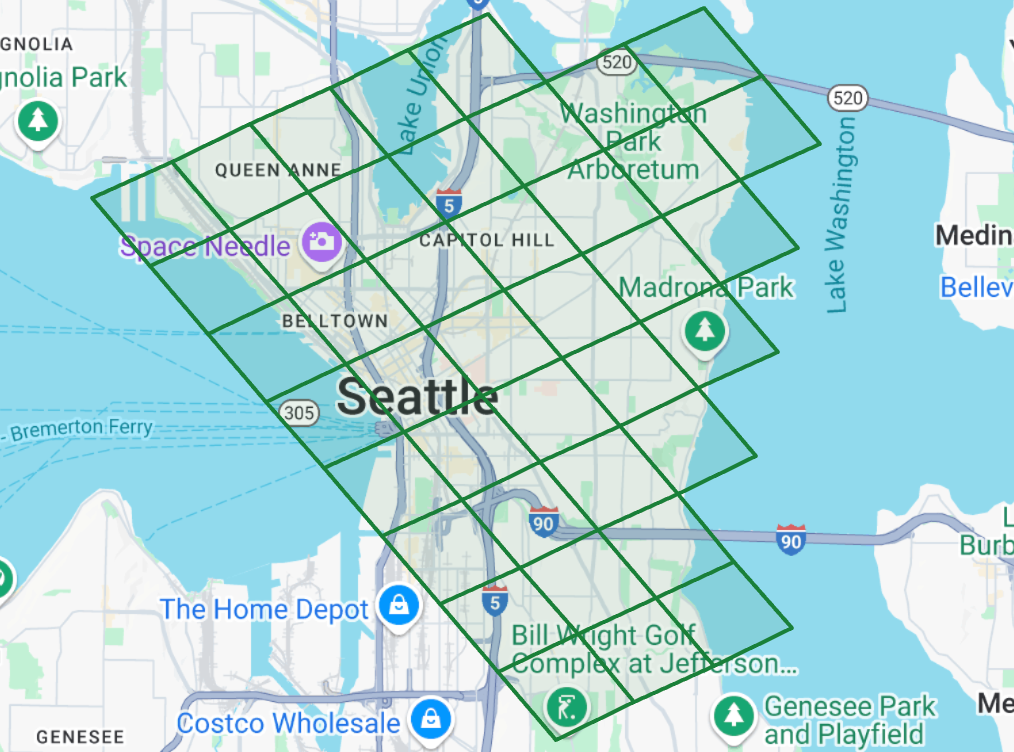
Example of a spatial partition of a metro area into zones. Demand calibration estimates the number of trips that start in one zone and finish in another. (Source: Google Maps)
Historically, the most commonly used type of traffic data for modeling purposes has been spatially sparse vehicular count data. Recently, we have improved on that by incorporating road speed data, which is spatially non-sparse. For our new calibration approach, we also use aggregated and anonymized path travel time data (i.e., the estimated average time it takes to travel along a specific route or path between two points within a road network), which provides a more spatially complete understanding of congestion patterns throughout the network.
We calibrate traffic demand for six metropolitan areas (Seattle, Denver, Philadelphia, Boston, Orlando, and Salt Lake City) using the open-source SUMO simulation software to model their highway networks. Our calibration algorithms combine road network and historical traffic data with these SUMO simulated networks to optimize the input parameters of these simulators, yielding realistic simulated traffic statistics (e.g., travel times, speeds).
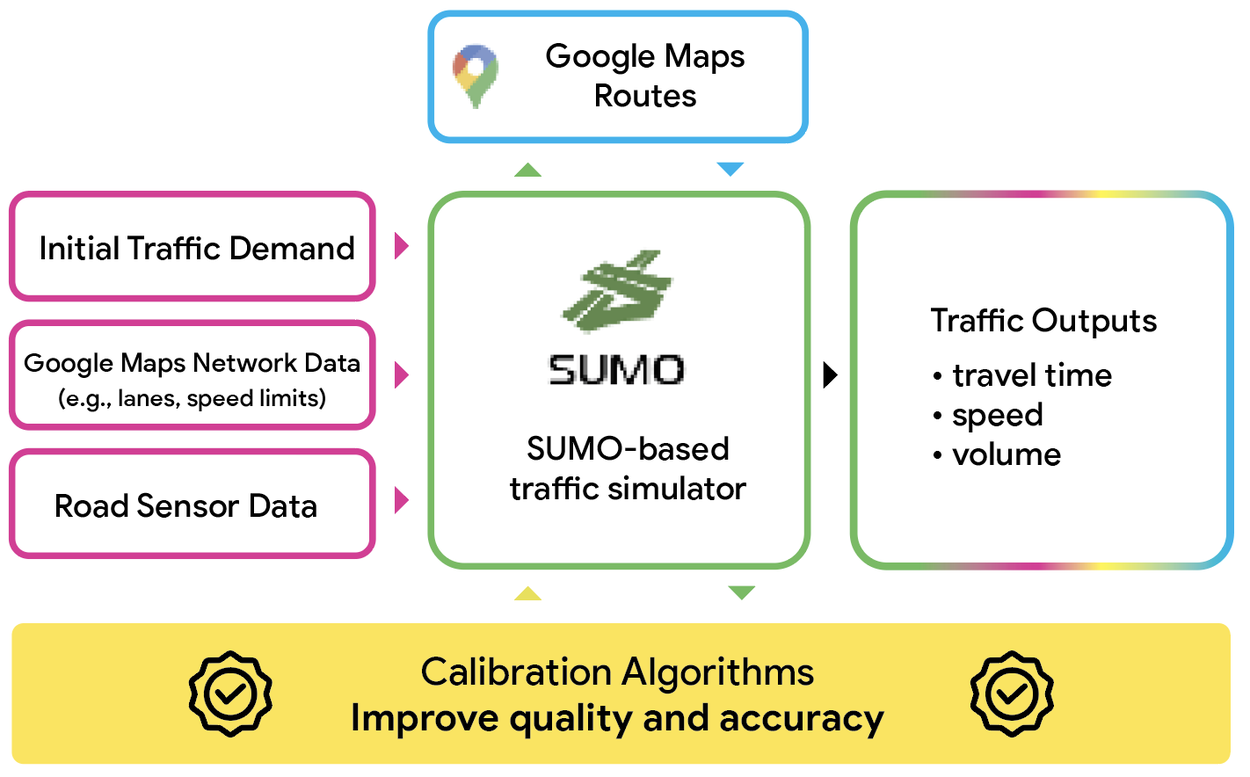
Overview of our simulation calibration framework.
The corresponding highway road networks are large scale, containing from 6,600 up to 18,600 modeled roads (or segments). The corresponding demand estimation optimization problems are high dimensional, ranging from 600 to 1,700.
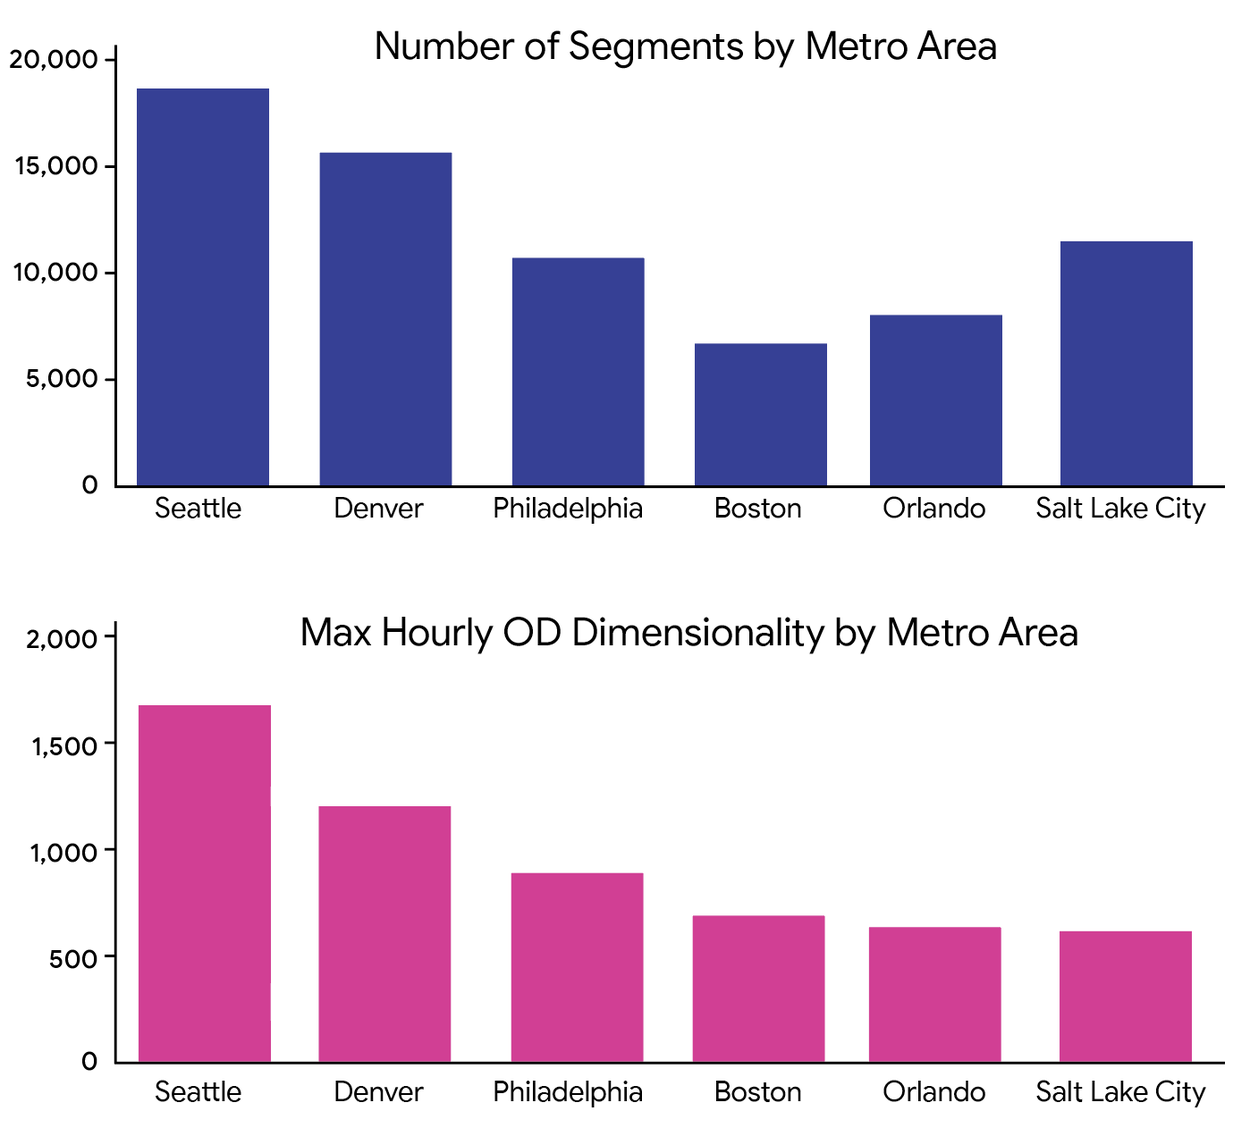
The number of segments (i.e., links or roads) in the network and the maximum number of origin-destination zone pairs.
For each city, we calibrate the hourly demand from 2pm to 11pm on a typical weekday. This period includes the afternoon peak hours as well as the off-peak hours, allowing us to evaluate the algorithm’s performance under different congestion levels. For each scenario (i.e., city and hour combination), we use aggregated and anonymized path travel time data as the ground truth.
Results
Our baseline for comparison is the commonly used simultaneous perturbation stochastic approximation (SPSA) algorithm. The calibration quality of each approach is measured by the normalized root mean square error (nRMSE), the particular form of which is described in our paper. The nRMSE can be interpreted as the relative error in the fit to the traffic data. For example, an nRMSE value of 0.2 means that there’s an average 20% error in the simulated travel time data compared to the historical traffic data. The plots compare the percentage improvement of the nRMSE of our metamodel calibration compared to the SPSA nRMSE.
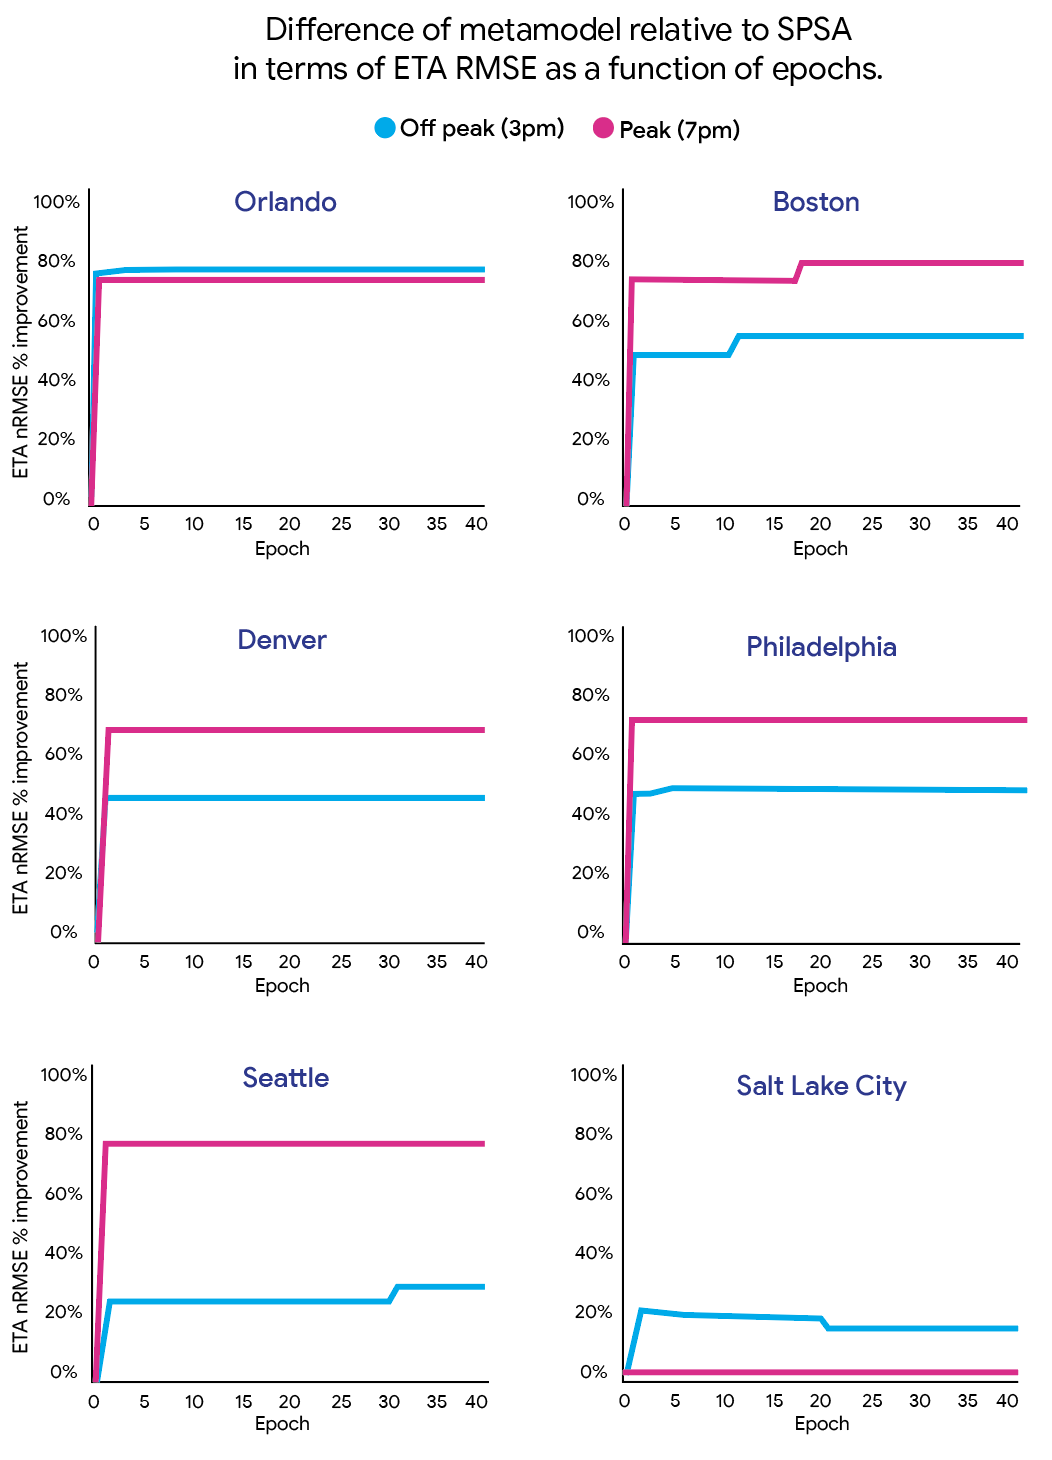
Path travel time nRMSE for off-peak (3pm–4pm) and peak (7pm–8pm) hours: SPSA vs. our metamodel method. Each curve considers a given hour and illustrates the performance as percentage improvement between path travel time nRMSE of the metamodel compared to SPSA.
As the algorithm progresses, the metamodel consistently outperforms SPSA, rapidly establishing its advantage. The metamodel achieves a maximum 78% reduction in path travel time nRMSE during peak hour (Boston, 7pm) and a 76% reduction during a non-peak hour (Orlando, 3pm). Even across all cities and both hours (3pm and 7pm), the metamodel’s calibration quality is 52% better than the baseline SPSA. This sustained improvement ultimately leads to the metamodel generating higher-quality calibrated demand than SPSA, consistently across all cities and congestion levels.
Across all scenarios being calibrated, the metamodel yields a 44% average improvement. The most substantial improvement was observed for Salt Lake City during the afternoon peak traffic congestion period (i.e., 6pm–7pm) where the metamodel outperformed SPSA by 80%.
What’s next?
Our work shows how non-sparse path travel times can be used to enhance the quality of urban mobility digital twins. This overcomes the main challenges of traditional calibration data: vehicular traffic counts, which rely on sparsely located sensors that are also costly to install and to maintain. Our work is shown to be scalable across metropolitan areas. Compared to SPSA, a commonly used algorithm, our method systematically and significantly improves demand calibration quality.
Nevertheless, challenges remain around the number of demand inputs leading to equivalent congestion patterns. As such, our ongoing work focuses on methods to account for this input uncertainty and quantify its impact on output uncertainty. Accounting for these uncertainties helps improve counterfactual robustness, which allows digital twins to better evaluate the impact of urban mobility policies, such as the deployment of congestion pricing or of new transit services. Other ways to improve counterfactual robustness include devising new problems and algorithmic formulations that exploit more information from traffic data, such as going beyond the use of first-order sample statistics. This is another way to help us better understand and replicate congestion patterns, ultimately leading to less congested roads and improved quality of life.
Acknowledgements
This work was done in collaboration with Neha Arora, Yechen Li, and Damien Pierce. The authors also thank Andrew Tomkins, Yi-fan Chen, and Craig Boutilier for strategic guidance, Ivan Kuznetsov for product management, Iveel Tsogsuren, Martin Mladenov, and Chih-wei Hsu for general framework contributions, and Sheila de Guia for program management and coordination.
Quick links
Other posts of interest
-

March 12, 2026
Protecting cities with AI-driven flash flood forecasting- Climate & Sustainability ·
- Earth AI ·
- Generative AI ·
- Open Source Models & Datasets
-
March 12, 2026
Introducing Groundsource: Turning news reports into data with Gemini- Climate & Sustainability ·
- Generative AI ·
- Natural Language Processing ·
- Open Source Models & Datasets
-

March 6, 2026
Where wild things roam: Identifying wildlife with SpeciesNet- Climate & Sustainability ·
- Earth AI ·
- Generative AI ·
- Open Source Models & Datasets


