Monitoring the World's Forests with Global Forest Watch
February 20, 2014
Posted by Crystal Davis, Director of Global Forest Watch, the World Resources Institute, and Dave Thau, Developer Advocate, Google Earth Engine
Quick links
By the time we find out about deforestation, it’s usually too late to take action.
Scientists have been studying forests for centuries, chronicling the vital importance of these ecosystems for human society. But most of us still lack timely and reliable information about where, when, and why forests are disappearing.
This is about to change with the launch of Global Forest Watch—an online forest monitoring system created by the World Resources Institute, Google and a group of more than 40 partners. Global Forest Watch uses technologies including Google Earth Engine and Google Maps Engine to map the world’s forests with satellite imagery, detect changes in forest cover in near-real-time, and make this information freely available to anyone with Internet access.
By accessing the most current and reliable information, everyone can learn what’s happening in forests around the world. Now that we have the ability to peer into forests, a number of telling stories are beginning to emerge.
Global forest loss far exceeds forest gain
 |
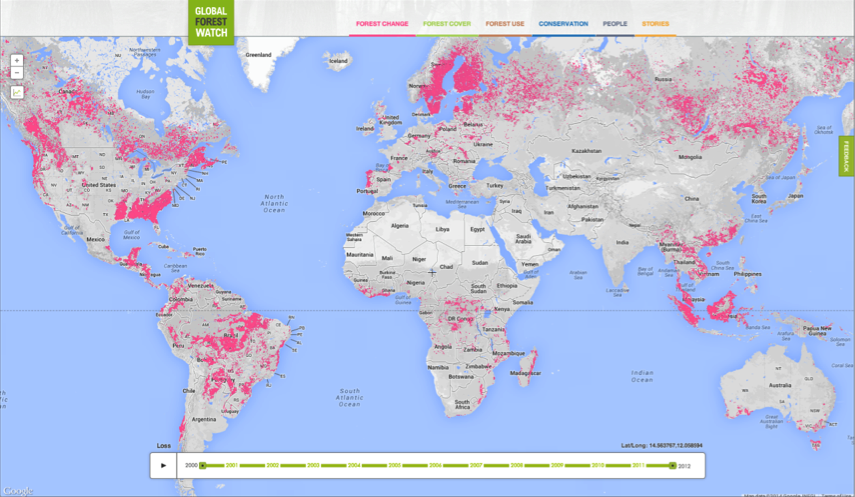
| Pink = tree cover loss |
 |
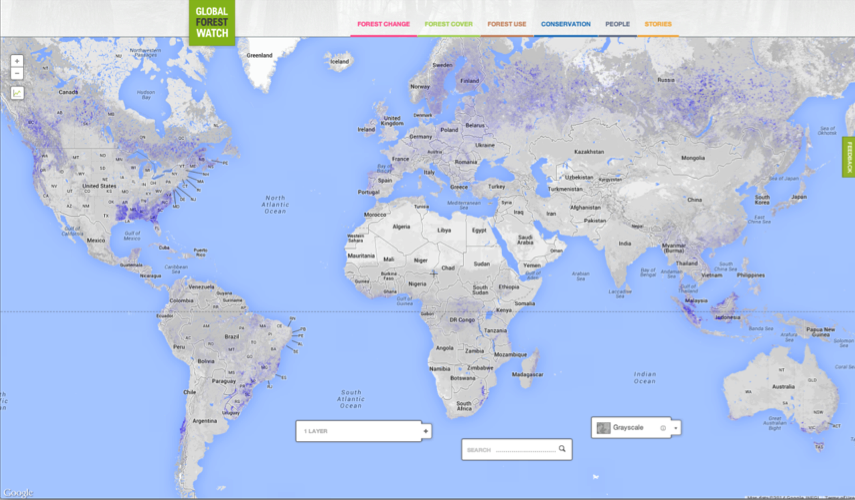
| Blue = Tree cover gain |
According to data from the University of Maryland and Google, the world lost more than 500 million acres of forest between 2000 and 2012. That’s the equivalent of losing 50 soccer fields’ worth of forests every minute of every day for the past 13 years! By contrast, only 0.8 million km2 have regrown, been planted, or restored during the same period.
The United States’ most heavily forested region is made up of production forests
 |
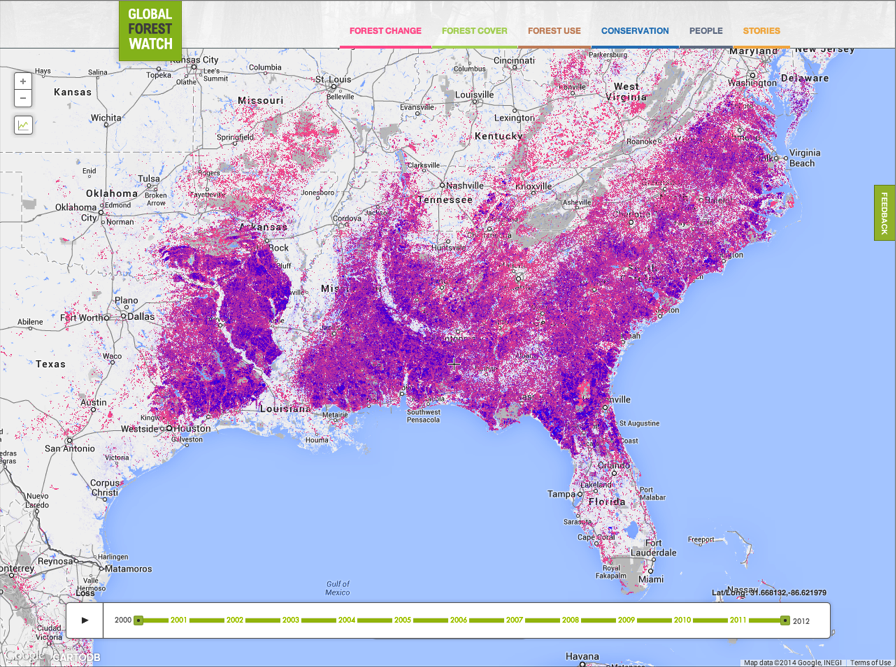
| Pink = tree cover loss Blue = Tree cover gain |
The Southern United States is home to the nation’s most heavily forested region, making up 29 percent of the total U.S. forest land. Interestingly, the majority of this region is “production forests.” The mosaic of loss (pink) and gain (blue) in the above map shows how forests throughout this region are used as crops – grown and harvested in five-year cycles to produce timber or wood pulp for paper production.
This practice of “intensive forestry” is used all over the world to provide valuable commodities and bolster regional and national economies. WRI analysis suggests that if managers of production forests embrace a “multiple ecosystem services strategy”, they will be able to generate additional benefits such as biodiversity, carbon storage, and water filtration.
Forests are protected in Brazil’s indigenous territories
 |
| Pink = tree cover loss Dark green = forest Light green = Degraded land or pastures |
The traditional territory of Brazil's Surui tribe is an island of green surrounded by lands that have been significantly degraded and deforested over the past 10+ years. Indigenous communities often rely on forests for their livelihoods and cultural heritage and therefore have a strong incentive to manage forests sustainably. However, many indigenous communities struggle to protect their lands against encroachment by illegal loggers, which may be seen in Global Forest Watch using annual data from the University of Maryland and Google, or monthly alerts from Imazon, a Brazilian NGO and GFW partner.
Make Your Own Forest Map
Previously, the data required to make these maps was difficult to obtain and interpret, and most people lacked the resources necessary to access, view, and analyze the the information. With Global Forest Watch, this data is now open to anyone with Internet access. We encourage you to visit Global Forest Watch and make your own forest map. There are many stories to tell about what is happening to forests around the world—and your stories can lead to action to protect these special and threatened places. What story will you tell?
-
Labels:
- Product


