Learning DeepVariant's hidden powers
October 22, 2024
Atilla Kiraly and Yuchen Zhou, Software Engineers, Google Research, Genomics Team
We examined the DeepVariant model to determine what insights it has developed, and we discovered that it utilizes insights generally applied in other tasks but on which it is not trained.
Quick links
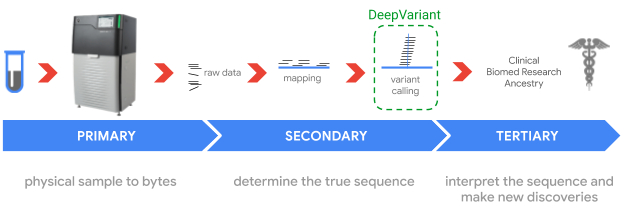
DNA is composed of the chemicals adenine, thymine, cytosine, and guanine, represented by the letters A, T, C, and G, respectively. The majority of variations from a typical human DNA sequence are small, either converting a single letter to a different one (e.g., A → T) or inserting or deleting a small number, which could change the structure or activity of a protein or alter the expression of genes. DeepVariant, Google's state-of-the-art variant caller, is able to accurately identify these genetic variants from sequencing data, which is important for diagnosing rare diseases and understanding genetic predispositions to chronic illness.
DeepVariant is trained on a set of six well-characterized human cell lines from the National Institute of Standards and Technologies (NIST). Variants in the genetic sequences of these lines are well known, determined through sequencing with several technologies paired with manual curation. DeepVariant is trained by showing millions of examples of sequencing data along with the true label from NIST to classify variants, following a process similar to how computer vision models are trained to classify cats or dogs. While DeepVariant’s performance is impressive, we still do not fully understand what it is learning that enables it to surpass the performance of state-of-the-art tools on genomic variant identification tasks.
In this blog post, we discuss our recent investigations into the inner workings of the DeepVariant model as it analyzes genomics data. Inspired by prior research that revealed the knowledge synthesized by AlphaZero for playing chess, we used commonly used analysis methods to explore DeepVariant's decision making processes and to identify subtle concepts contained in the hidden knowledge of the neural network. DeepVariant is designed for the task of small germline variant detection, i.e., detecting differences in short genetic sequences (≤50 base pairs) inherited from the subject’s parents. Yet we discovered that it utilizes insights generally used for other tasks but on which it is not trained, including variant detection in sequences >1000 base pairs (structural variants) or those not inherited from parents (mosaic variants). This preliminary finding provides a starting point to understand DeepVariant’s capabilities and hidden knowledge, which may ultimately better contextualize why a method did or did not make a call and, therefore, how to interpret the results.
Examining DeepVariant
To better understand what DeepVariant is learning from its training data, we used a set of simple clustering and visualization methods to summarize the information captured in the model’s high dimensional data. In partnership with collaborators on the Google Genomics team, we first loaded examples into the Integrated Genomics Viewer (IGV), a widely-used tool for inspecting genomes and sequencing data. Then, we applied Uniform Manifold Approximation and Projection (UMAP) to the embeddings of the mixed5 max-pooling layer of the model, which is roughly in the middle of the network and contains a mix of low- and high-level features. This visualization method enables one to visually inspect any emerging structures. We used different colors to represent known sequencing attributes in the input data (e.g., low quality sequence reads and regions that are hard to uniquely map in the genome) and a combined attribute using different value combinations of the basic attribute.
The structures that emerged reveal that some of the attributes’ values are mapped close to each other, naturally forming clusters. We observed that these “natural clusters” form at different levels across model layers, and at times get “forgotten” as the network further processes the input. This suggests that different types of information about the input DNA reads are important to different depths of the network.
Based on this first look, we then used additional clustering methods with the hope of “discovering” previously unknown attributes (clusters). We began by applying k-means clustering to find 10 clusters. K-means is a simple clustering algorithm that groups data points by proximity in vector space, without use of labels that might indicate similarity. This results in visual separation between major clusters, some of which are much more populous than others. To have control of the size of resulting clusters, we then applied hierarchical clustering by running k-means multiple times; first we run 3-cluster k-means, then for each of the three clusters we apply a second round k-means to further divide the clusters, where the cluster number is based on the shape and size of the first round clusters.
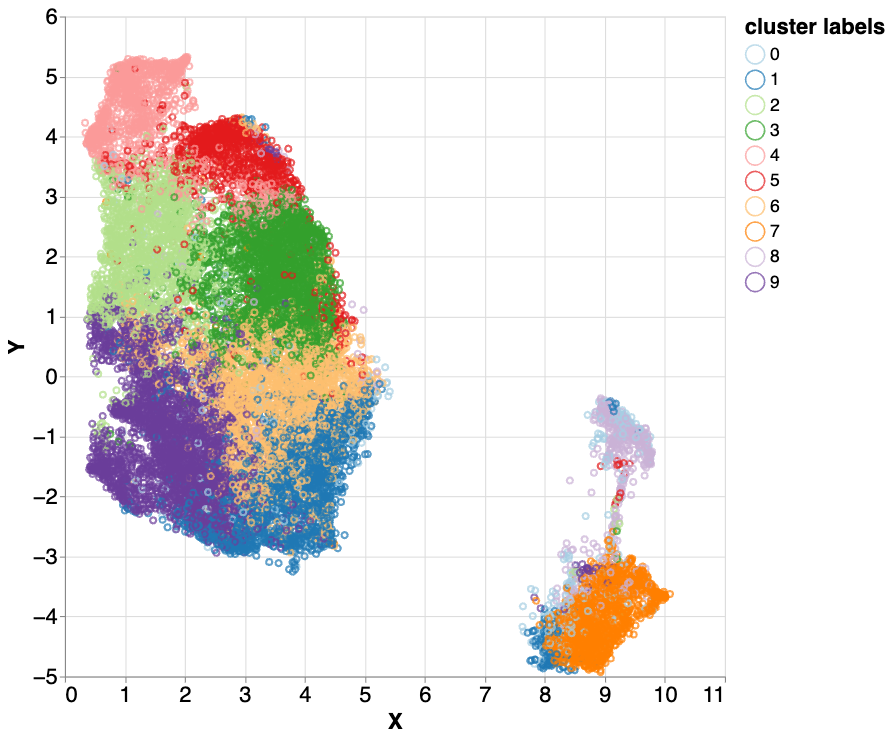
Hierarchical k-means clustering applied to the mixed5 layer embeddings. Different colors represent label-independent hierarchical k-means clusters. Three clusters (2 - light green, 3 - green, and 5 - red) all correlated with difficult to map parts of the genome. With further investigation, we found nuanced differences between these three highly similar clusters, which encouraged us to examine them more closely.
Discovery of LINEs
We then iteratively examined the clusters in an effort to identify meaningful correlations. Three clusters (2 - light green, 3 - green, and 4 - red) all correlated with difficult to map parts of the genome, but differed in the amount of sequencing data (sequence depth) in the region. Low sequencing depth can indicate parts of the genome that are difficult for an instrument to sequence or difficult to map regions. High sequencing depth can suggest sequences that have multiple similar copies in the genome or extra copies in an individual. The fact that these three clusters had similar characteristics but varied in sequence depth suggested a property that was being leveraged by the model. This raised the question, what property of the genome would vary so much by the number of copies that would be in parts of the genome that are repetitive?
One hypothesis was that these examples could be within long interspersed nuclear elements (LINEs), which are long sequence regions (~6000 pairs) that have the unique ability to copy themselves within the genome (i.e., large genomic rearrangement). The movement of LINEs around the genome can change which parts of DNA are used to make proteins, and have been suggested to be important in human brain evolution in our ancient past.
To answer this, we labeled the dataset with known LINEs from the UCSC Genome track annotations and examined the percentage of the LINE elements in the input samples that were clustered. We found that three clusters had a large fraction of LINEs (83.9%, 70.3%, and 43.9%). The LINEs in these three clusters accounted for 61.3% of the total number of LINE labels in the dataset.
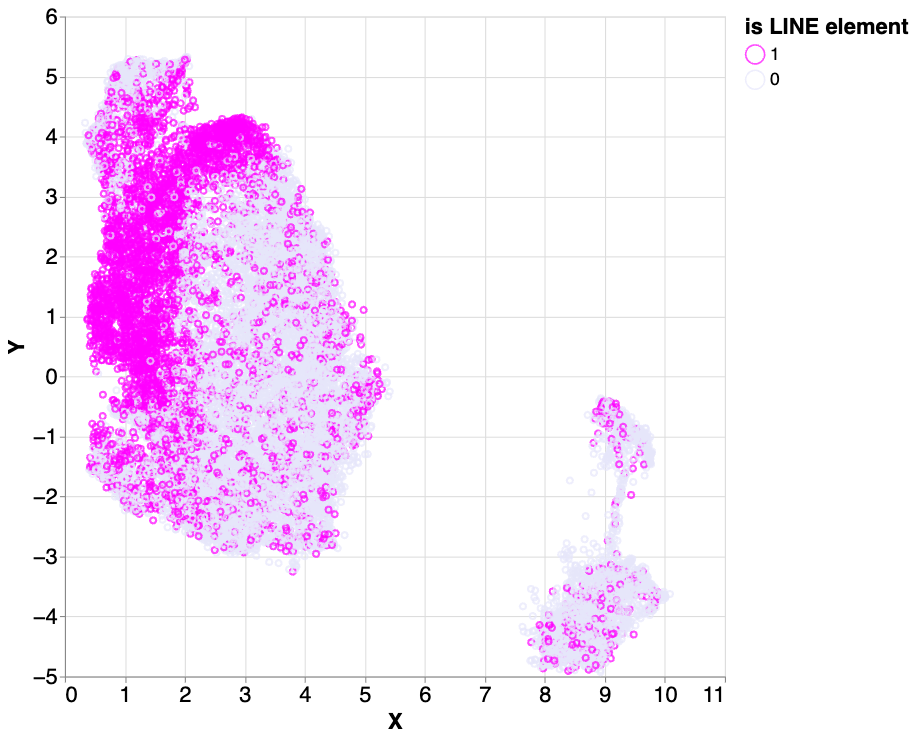
Using a dataset of known LINE element labels, we calculated the ratios of LINE elements in the cluster 2 (light green in the figure above), 5 (red) and 9 (purple). Of those three clusters, 83.9%, 70.3% and 43.9%, respectively, are labeled as LINEs.
In an attempt to verify this observation, we tried hierarchical clustering with a different method, spectral clustering, in place of k-means. Interestingly, this approach also clustered most of the LINEs, but in different shapes of clusters. We found two of the spectral clusters to match the LINE region very well. 57.3% of LINEs in our dataset fall in those two clusters; 86.2% of cluster 1 (blue) and 70.8% of cluster 2 (light green) samples are LINEs.
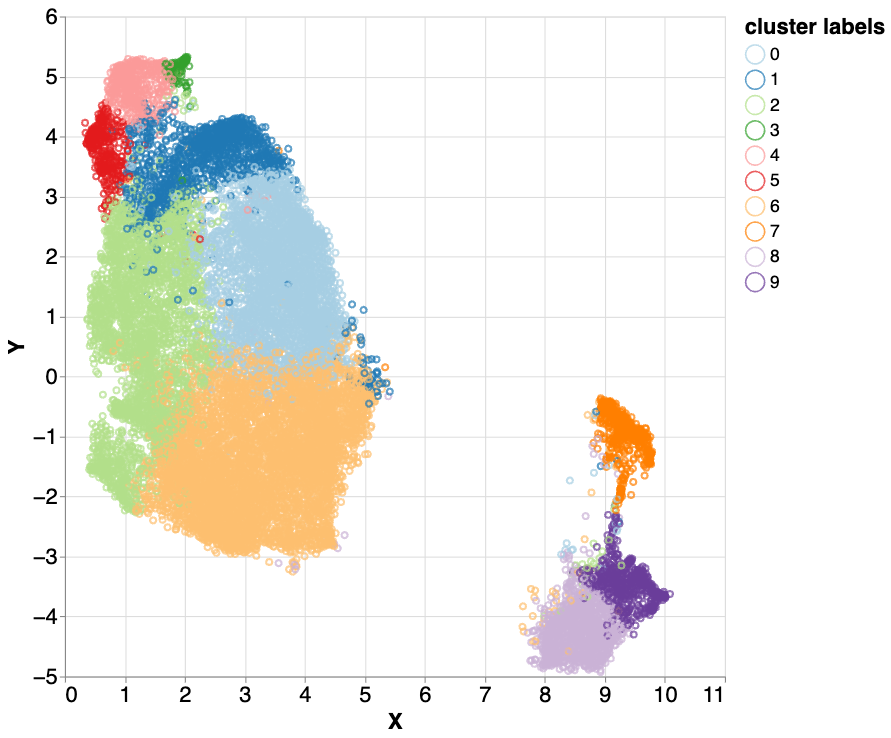
We repeated the clustering process on the mixed5 layer embeddings using a different method, hierarchical spectral clustering. Interestingly, this method also clustered the majority of LINE elements in two of the clusters (cluster 1 - blue and cluster 2 - light green).
Discovery of mosaic variants
Following a similar process on the same input data, we used UMAP to visualize the data of the mixed5 layer, then applied standard k-means clustering to identify six clusters. We then examined samples from the more isolated clusters, and identified six that had features consistent with variants arising from mutations that occur after conception, called mosaic variants. Mosaics are a class of variants that can result in serious health effects, including the development of cancers.
Then, following the same procedure as above, we leveraged a recent mosaic truth set from NIST to investigate this possibility. We updated the dataset to include 42 labeled known mosaic examples from another subject and then repeated the clustering procedure. We found that 100% of these also fell into the same cluster as the original six suspected mosaic samples.
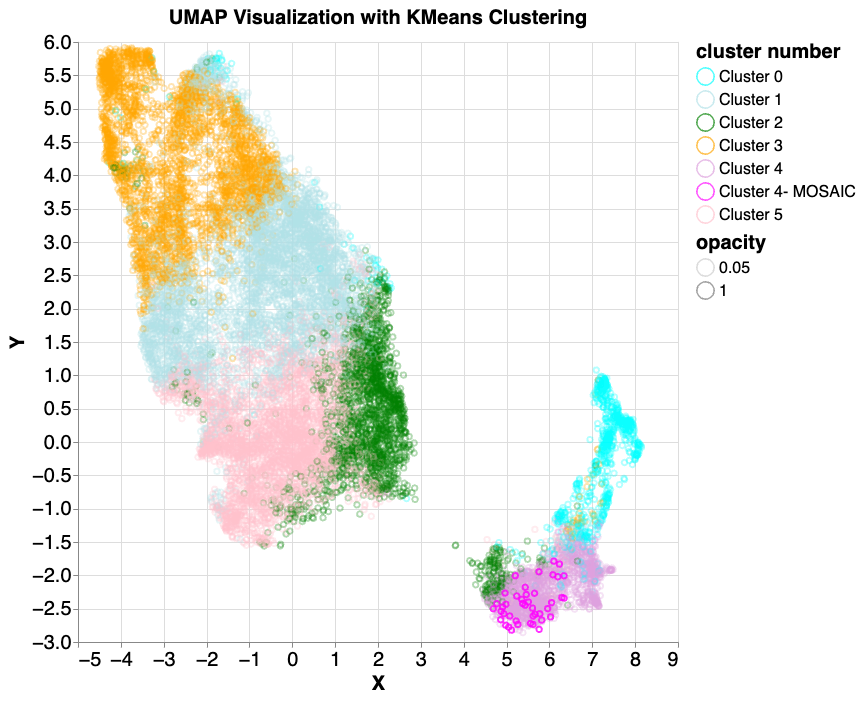
As above, we performed k-means clustering on the mixed5 embedding layer samples. In cluster 4 (lavender colored, lower right), 6 mosaic-like samples were identified. 42 true mosaic samples (shown in magenta) were then introduced and the same k-means and UMAP model was applied. All (100%) mosaic examples were found to fall into the same cluster.
Finally, we explored whether using multiple layers across the model architecture, which contain both low- and high-level features, would lead to new insights. We extracted normalized embeddings for all samples from six chosen layers. We performed principal component analysis (PCA) individually for each layer embedding to reduce the dimension to the top 200 components. Next, a second PCA was applied to the 1200 components concatenated from all embeddings to reduce the total to 200 components per sample. Using the same k-means clustering approach as before, this time with 12 clusters, mosaic samples were further isolated into a smaller cluster that contained 41 of the 42 samples.
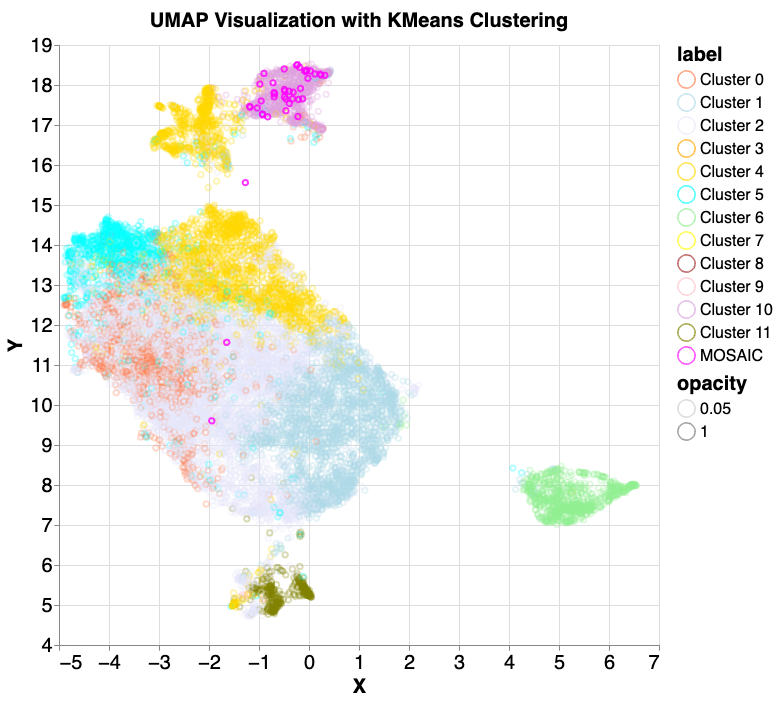
We performed principal component analysis (PCA) on selected embedding layers, concatenated the results and then conducted PCA again before UMAP visualization and 12 component k-means clustering. We then reintroduced the 42 mosaic samples, and all but one (97.6%) fell into cluster 10 (lavender). Note that while k-means clustering and UMAP dimensionality reduction often produce similar groupings, they don't perfectly align. This mismatch can make it seem like points belonging to different k-means clusters are intermingled in the UMAP visualization, though they are distinct according to k-means.
Discussion
Interestingly, DeepVariant is never explicitly told what LINEs or mosaic variants are, either as training labels or as input annotations. Further, while a typical LINE is around 6000 pairs long, DeepVarient only sees 221 pairs at a time. The fact that DeepVariant’s activations can be clustered in a way that isolates these variants suggests that concepts from analyzing larger genome rearrangement may inform the task of small variant calling, leading to improved performance. This may be an example both of how concepts from adjacent fields are relevant to a problem and how deep learning methods might apply these ideas to more accurately model the task they are trained to solve.
Conclusion
By examining, clustering, and visualizing how the internal activations of DeepVariant’s neural network manifest for different samples, we identified previously unrecognized influences from the underlying biology and bioinformatics that seem to be important in DeepVariant’s ability to classify the hardest examples. In addition to highlighting the importance of considering mobile DNA elements, copy number variants, and mosaicism during variant calling, this highlights how achieving the highest accuracy on difficult problems could benefit from expansive consideration of related areas. It also suggests that inspecting other types of ML models trained to analyze DNA sequences may learn previously unappreciated aspects of the problem.
Acknowledgements
We thank Been Kim from Google DeepMind for contributing her expertise in explainability as an advisor to the project, Pi-Chuan Chang from Google Research for supervising the project and contributing her engineering and machine learning expertise on DeepVariant, and domain expert Andrew Carroll from Google Research for contributing knowledge of the genome and sequencing, and for providing curations. We also thank Maria Nattestad, formerly of Google Research, for initiating the explainability work with Been and bringing her into the project. Finally, this work would not have been possible without the work of Justin Zook, Nathan Dwarshuis, and Justin Wagner from NIST who created the truth sets used to evaluate DeepVariant calls, and with whom fruitful discussion over years regarding explainability methods for ML applications in genomics has been invaluable.
Quick links