Open Buildings 2.5D Temporal dataset tracks building changes across the Global South
September 19, 2024
John Quinn, Software Engineer, Google Research
Advances in building detection from public satellite imagery lead to a pioneering open dataset of building changes across the Global South.
By the year 2050 the world's urban population is expected to increase by 2.5 billion, with nearly 90% of that growth occurring in cities across Asia and Africa. To effectively plan for this population growth, respond to crises, and understand urbanization’s impact, governments, humanitarian organizations, and researchers need data about buildings and infrastructure, including how they are changing over time. However, many regions across the Global South lack access to this data, hindering development efforts.
In 2021, we launched the Open Buildings dataset, significantly increasing the number of publicly mapped buildings in Africa. We later expanded the effort to include buildings in Latin America, the Caribbean, and South and Southeast Asia. Since then, the Open Buildings dataset has been widely used by UN agencies, NGOs and researchers for planning electrification, crisis response, vaccination campaigns, and more.
Open Buildings dataset users have requested data showing building changes over time, which can improve urban planning and help us better understand changes in human impact on the environment. Another common request is for approximate building heights, which can help estimate population density for disaster response or resource allocation efforts. Both of these are challenging due to the limitations of available high-resolution satellite imagery captured only at certain places and times. For some rural locations and the Global South the last imagery was captured years ago, making it challenging to effectively track changes or understand the current situation.
To that end, we introduce the Open Buildings 2.5D Temporal Dataset, which is based on new experimental results that estimate changes over time and provide height data for buildings across the Global South. The dataset annually generates a map of estimated building presence, counts and heights from 2016 to 2023, and covers a 58M km2 region across Africa, Latin America, and South and Southeast Asia using 10m resolution imagery from Sentinel-2. It can be accessed at the Open Buildings site or through Earth Engine.
Construction of New Cairo, Egypt visualized using the Open Buildings 2.5D Temporal Dataset.
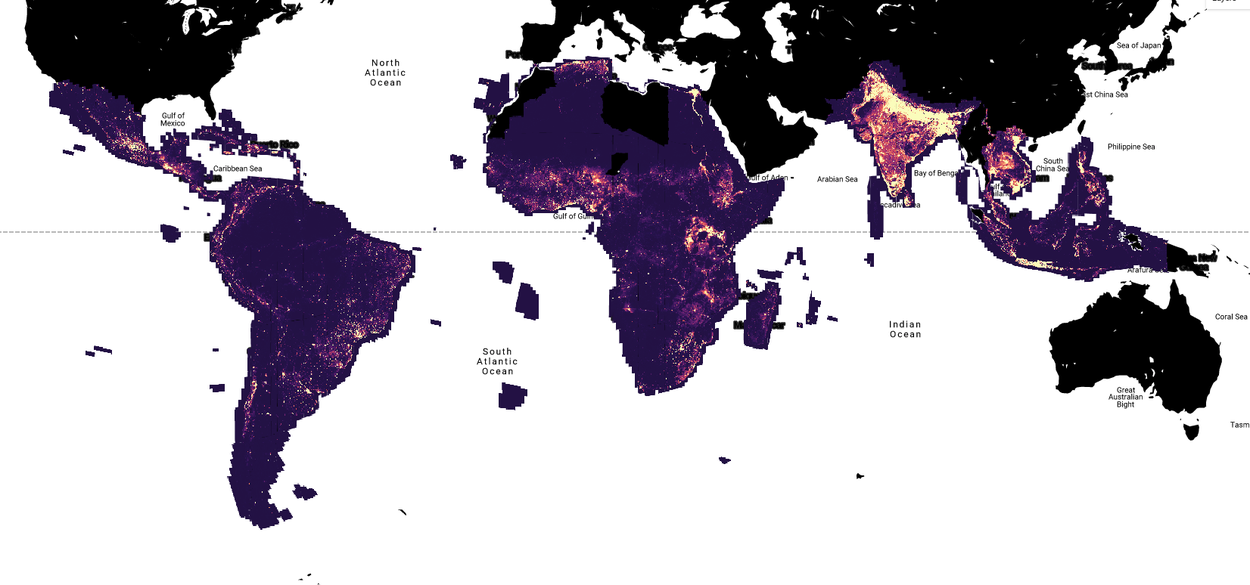
Relative building density in 2023 derived from the Open Buildings 2.5D Temporal dataset.
The Open Buildings 2.5D Temporal dataset
The Open Buildings Dataset detected buildings using ML models that could process high-resolution satellite imagery, distinguishing finer image details. However, the challenge with high-resolution imagery is that it may have been years since the last imagery was captured in some locations, making this approach less effective in tracking changes over time.
Building footprints in Kampala, Uganda, detected using high-resolution (50 cm) satellite imagery.
To address this problem, we used the Sentinel-2 public satellite imagery made available by the European Space Agency. While Sentinel-2 imagery has a much lower level of detail, every point on Earth is captured roughly every five days and each pixel on the ground is a 10 m square. This data richness enables us to detect buildings at a much higher resolution than we can see in a single image.
Sentinel-2 imagery and the high-resolution buildings data layer that our model extracted from it.
For a single prediction, we use a student and teacher model method (described in greater detail below) that takes up to 32 time frames of low-resolution images for the same location. Sentinel-2 satellites revisit every location on Earth every five days, capturing a slightly different viewpoint each time. Our method takes advantage of these shifted images to improve image resolution and accurately detect buildings. This is similar to how Pixel phones use multiple photos taken with camera shake to output sharper photos.

The field of view changes slightly between each Sentinel-2 image.
Both student and teacher models are based on HRNet with some modifications to the student model to share information between channels representing different time frames. First, we create a training dataset with corresponding high-resolution and Sentinel-2 images at 10 million randomly sampled locations. The teacher model takes the high-resolution images and outputs training labels. The student model, which operates on sets of Sentinel-2 images only and is unable to see the corresponding high-resolution images, aims to recreate the teacher model’s high-resolution predictions. It can take a stack of Sentinel-2 images and recreate what the high-resolution teacher model would have predicted.
The teacher model outputs high-resolution training labels for the student model.
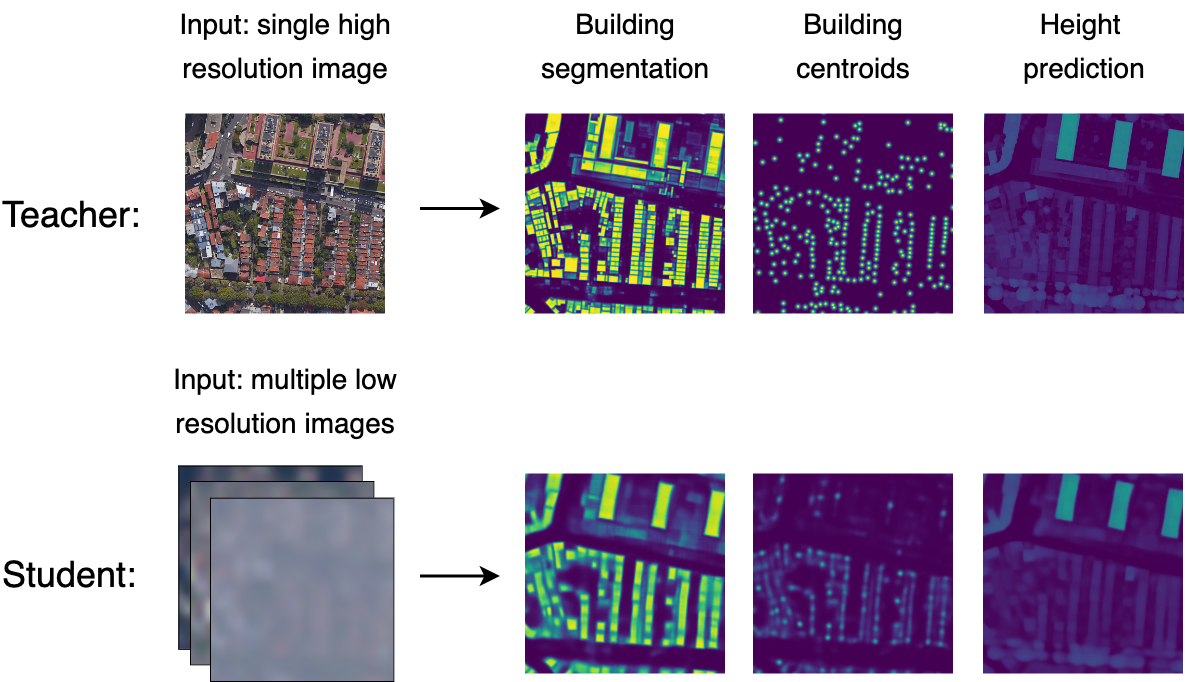
The student model takes a stack of Sentinel-2 images (bottom) to recreate the predictions from the teacher model (top) without access to high resolution images.
To help spatially align the model output, the model also produces a super-resolution grayscale image, which is an estimate of what a gray version of the high resolution image would look like. When we run the student model on all Sentinel-2 imagery available for a specific location, with a sliding window of 32 frames, we’re able to see the changes on the ground over time. For example, the animation below shows growth on the outskirts of Kumasi, Ghana, with building presence, road presence and super-resolution grayscale image.
Buildings and roads being constructed on the outskirts of Kumasi, Ghana.
We find that it’s possible to obtain a level of detail from this type of data (78.3% mean IoU) that approaches our high resolution model (85.3% mean IoU). While we are releasing annual data today, given the modeling approach, it is technically possible to generate data at more frequent intervals.
Counting buildings
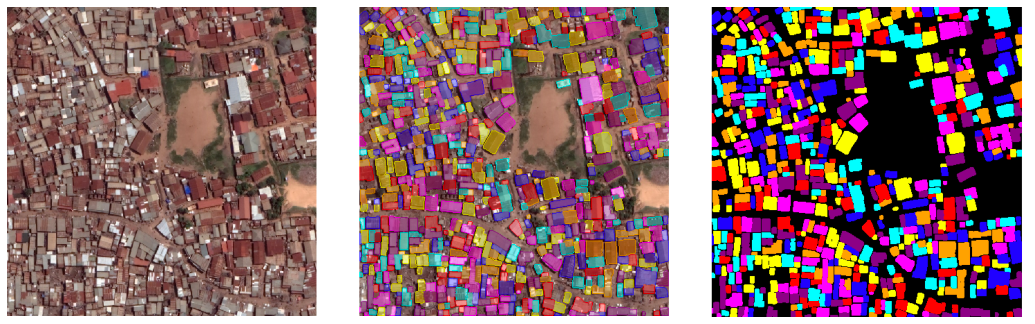
For many analysis tasks involving buildings, it is necessary to estimate the number of buildings in a particular area. The raster data we generate cannot directly be used to identify individual buildings. However, we found it possible to add an extra head (output) to the model which gives us a direct prediction of building count across a given area.
Left to right: High-resolution image for reference; RGB channels from top of Sentinel-2 stack; human labels based on high-resolution imagery; training target mask; segmentation output.
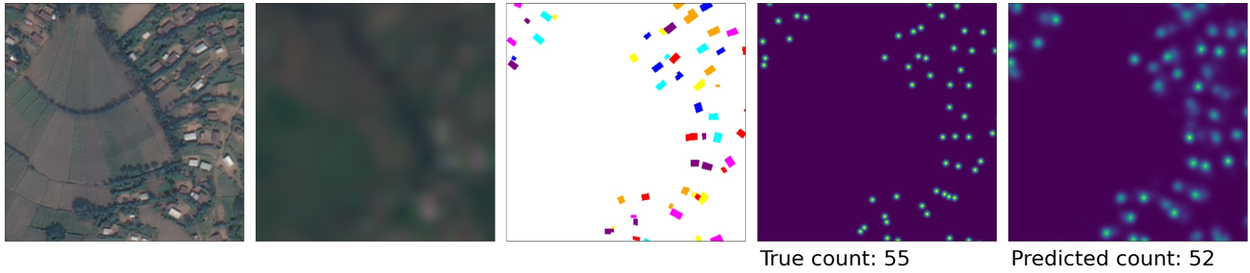
We train this model head by labeling the centroid of each building. At test time, the model predicts one constant center per building, regardless of the size of that building and even in cases where buildings are close together. We’ve found that for this model, while the centroid may not always be at the center of buildings, the sum of the predictions across every pixel is strongly correlated with the count of buildings. In this way, we can estimate the count of buildings each year even for large areas. We evaluated the accuracy of counts for 300 ×300 m tiles in terms of coefficient of variation (R2) and mean absolute error (MAE), and see that the estimates are consistent on both an absolute and a log scale (the latter helping to show test cases with very low or high building density).
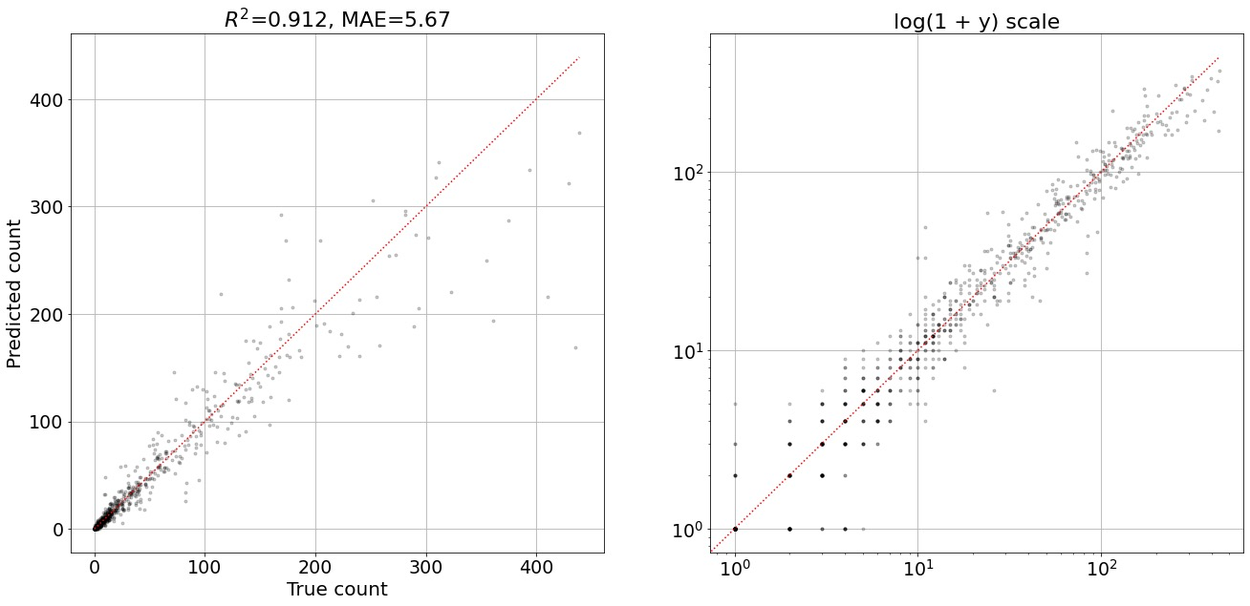
Evaluation of accuracy in counting the number of buildings in 300 m square tiles.
Estimating building heights
Approximate building height data can help estimate population density, where the approximate number of floors buildings have can help estimate the scale of impact from a natural disaster, or to understand if the building capacity in an area is sufficient for the population.
To do this, we added another output to the model that predicts a raster of building heights relative to the ground. Our building height training data was only available for certain regions, mainly in the US and Europe, so we have limited evaluation in the Global South and instead used a series of spot checks on buildings. Overall we found a mean absolute error in height estimates of 1.5 m, less than one building storey.
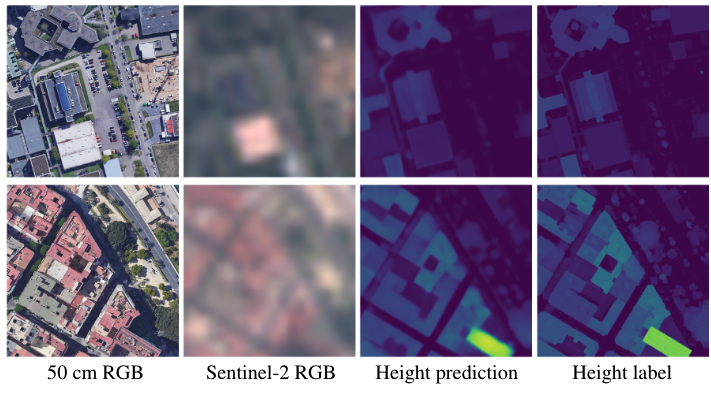
Sample per-pixel height predictions and ground truth.
Model limitations
While we have improved the level of accuracy obtained from Sentinel-2 10m imagery, this remains a very challenging detection problem, and it’s important to consider the model’s limitations when using the data for practical decision making. We recommend cross-referencing with another dataset to assess the accuracy for a particular location. For example, our high-resolution vector data provides a recent snapshot based on different source imagery. Visual comparisons with the satellite layer of a map can also help to identify discrepancies.
Our method relies on having a stack of cloud-free Sentinel-2 images for each location as input. In some areas, such as humid regions like Equatorial Guinea, there might be only one or two cloud-free images available for a whole year. In these cases, the results are less reliable or can manifest as some years having lower overall confidence or lower building counts, as shown below.
Inconsistency in spatial position and building detection confidence in Dhaka, Bangladesh, due to changes in satellite position and cloud cover.
There is a limit to the size of structures that can be detected. While we are able to pick up buildings significantly smaller than a single Sentinel-2 pixel, there is a limit for very small structures. Conversely, the model may output false detections, e.g., identifying snow features (example) or solar panels (example) as buildings.
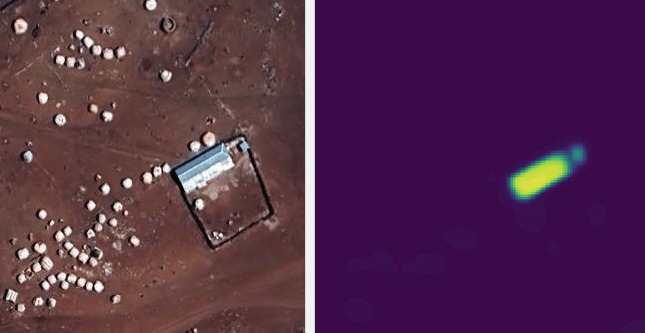
Small tent shelters in Baido, Somalia, not detected.
For many analysis tasks involving buildings, a vector data representation (e.g., polygons) is preferred, as the Open Building Dataset provided. However, the 2.5D Temporal buildings dataset is in a raster format that is harder to work with for some applications. Using further modeling to create vector footprints directly from this dataset or in combination with static high-resolution building footprints may be feasible, but remains an open research problem. The limited spatial registration between time frames can also affect analysis as buildings might appear to shift around or for their shape to vary. Some other issues with the dataset, such as tiling artifacts and false positives, are explained on the Open Buildings site.
Use cases
We have been working with partners who have shared feedback on the 2.5D temporal dataset, and started to leverage it in their work. Partners include WorldPop, who create widely-used estimates of global populations, UN Habitat, who deal with urban sustainability and the changing built environment, and Sunbird AI, who have assessed this data for urban planning and rural electrification.
Potential use cases of the Open Buildings 2.5D Temporal dataset include:
- Government agencies: Gain valuable insights into urban growth patterns to inform planning decisions and allocate resources effectively.
- Humanitarian organizations: Quickly assess the extent of built-up areas in disaster-stricken regions, enabling targeted aid delivery.
- Researchers: Track development trends, study the impact of urbanization on the environment, and model future scenarios with greater accuracy.
We invite researchers, policymakers, and development practitioners to explore the Open Buildings 2.5D Temporal dataset and share feedback with us. See the Open Buildings site for more information.
Acknowledgements
The team in Google Research who carried out this work and made the public release possible includes Wojciech Sirko, Krishna Sapkota, Juliana T. C. Marcos, Abigail Annkah, Olivia Graham, Emmanuel Asiedu Brempong, Abel Korme, Mohammed Alewi Hassen, Sella Nevo, Tomer Shekel, Abdoulaye Diack and Jason Hickey.
Other posts of interest
-

July 17, 2025
Measuring heart rate with consumer ultra-wideband radar- Hardware & Architecture ·
- Health & Bioscience ·
- Machine Intelligence
-

July 10, 2025
Graph foundation models for relational data- Algorithms & Theory ·
- Machine Intelligence
-

July 9, 2025
MedGemma: Our most capable open models for health AI development- Generative AI ·
- Health & Bioscience ·
- Machine Intelligence