Seeing beyond BMI: Estimating cardiometabolic risk with smartphone imagery
August 17, 2026
Cassie Zhou, Research Scientist, and Ahmed Metwally, Staff Research Scientist, Google Research
We demonstrate the feasibility of PhotoScan, a deep learning approach estimating body composition from smartphone photos, to predict insulin resistance with accuracy comparable to DXA scans in a clinical research setting.
Quick links
Insulin resistance is one of the most critical yet underdiagnosed drivers of modern metabolic disease. Predating the clinical onset of type 2 diabetes by years, impaired insulin sensitivity stealthily impairs vascular health, liver function, and energy metabolism long before fasting blood sugar rises into diagnostic ranges. Homeostasis Model Assessment for Insulin Resistance (HOMA-IR) models the feedback loop between liver glucose production and insulin secretion under steady-state fasting conditions, and a HOMA-IR score greater than 2.9 is considered insulin resistant based on epidemiological reviews. Recent studies demonstrate that multimodal machine learning frameworks integrating wearable sensor data with routine lab tests can accurately predict HOMA-IR to flag early metabolic risk. Integrating objective measures of body composition offers a vital complement to wearable technology; while wearables track daily physiological behaviors, body composition provides a distinct structural assessment of adiposity to form a complete picture of metabolic risk.
While knowing your total body fat percentage is a good baseline to measure adiposity versus lean mass, additional body composition biomarkers provide much deeper clinical insights. For instance, the Android-to-Gynoid fat ratio (A/G ratio) compares the fat stored in your trunk (an "apple" shape) versus your hips and thighs (a "pear" shape); the Visceral-to-Subcutaneous fat area ratio (V/S ratio) distinguishes between the highly metabolic internal fat surrounding your organs and the subcutaneous fat stored just beneath your skin. Elevated A/G ratios and higher visceral fat mass strongly correlate with insulin resistance prevalence. Currently, the gold standard for measuring true body composition is Dual-Energy X-Ray Absorptiometry (DXA) scans. These scans are incredibly precise, but aren't built for everyday screening because they are expensive, require specialized clinical infrastructure, and expose patients to low doses of radiation.
Building on the growing capability of smartphones to passively monitoring user health during daily use, such as continuous heart-rate monitoring, we introduce PhotoScan: an investigational deep learning framework that estimates three-dimensional body composition metrics including body fat percentage (BF%), A/G ratio and V/S ratio, directly from standard 2D smartphone photos. To build this, we pre-trained a deep neural network on over 35,000 participant records from the UK Biobank and fine-tuned it with a diverse new cohort of 677 adults. Validated across clinical cohorts, PhotoScan demonstrates higher body fat percentage accuracy than smartwatch-based bioelectrical impedance analysis (BIA) sensors while unlocking A/G and V/S ratios beyond BIA's capabilities, offering a scalable, non-invasive framework to predict insulin resistance with near-DXA accuracy.
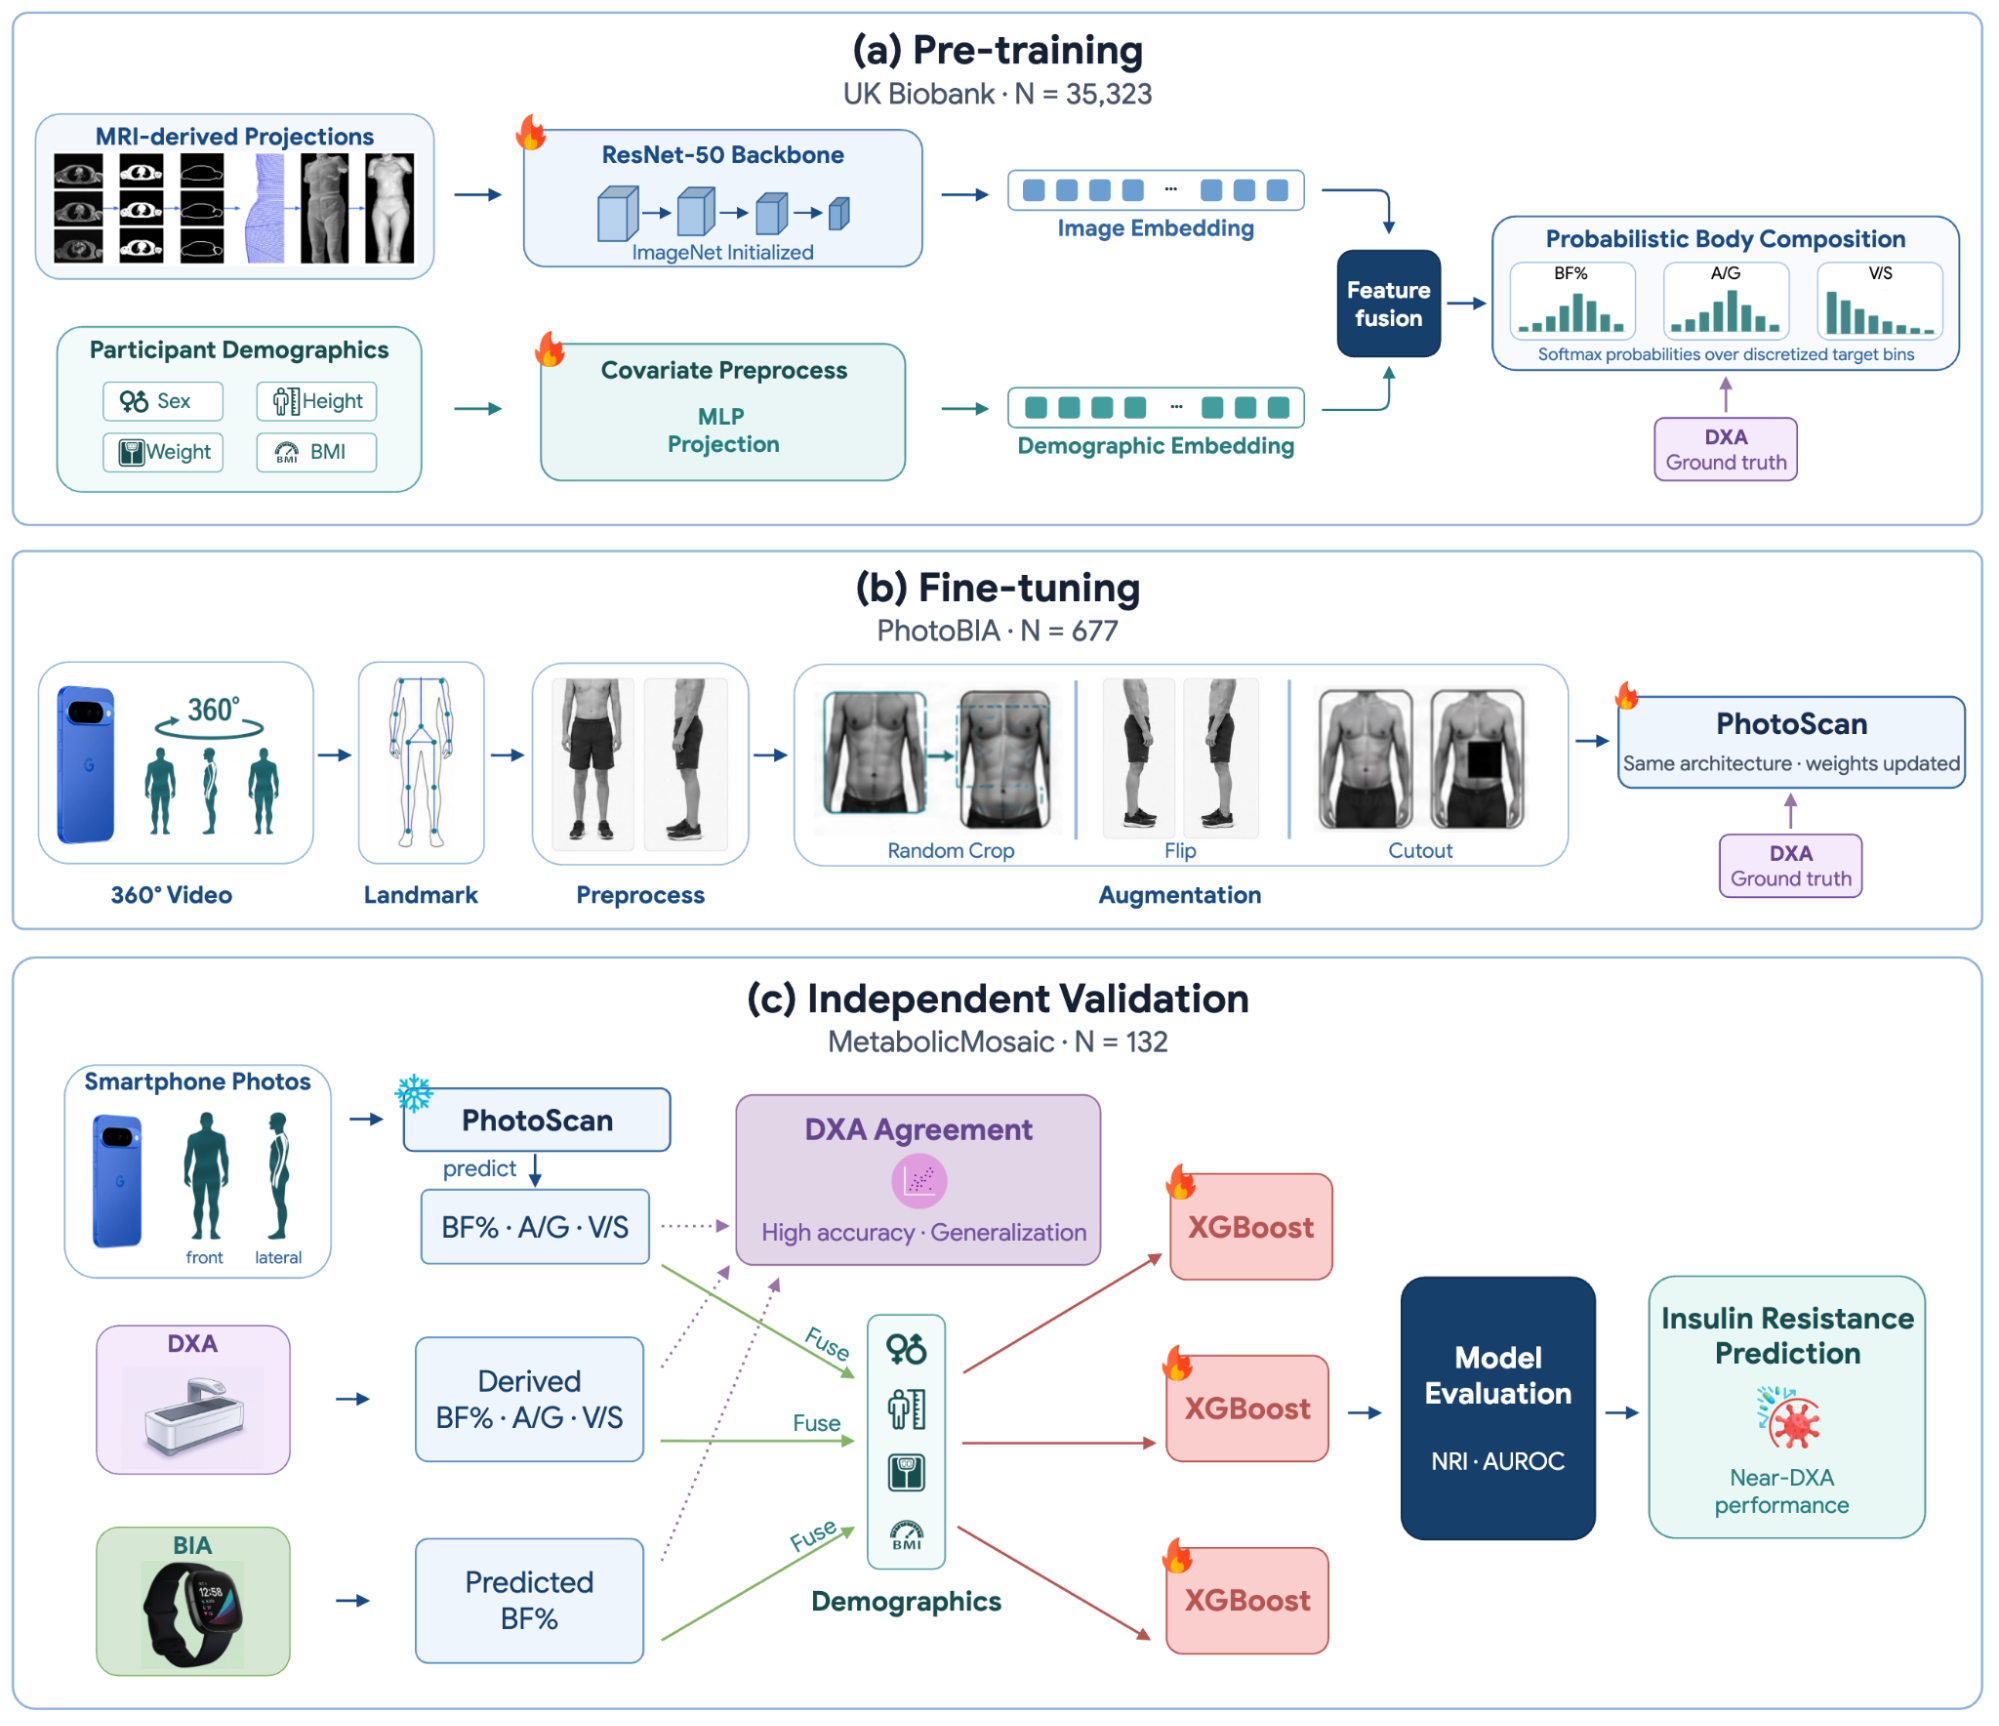
Overview of the body composition pipeline and insulin resistance classification. Body composition metrics are first estimated from the pretrained PhotoScan model, and the body composition features, combined with user demographics are used for insulin resistance classification.
How PhotoScan works
PhotoScan bypasses the clinical measurements by extracting geometric body information directly from smartphone images. We built and evaluated this framework in three key phases:
- Pre-training (UK Biobank, N = 35,323)
[73abd3] : With a subset from the UK BioBank dataset, which contains both MRI images and body composition ground truth from DXA, we trained a ResNet-50 backbone (initialized with ImageNet weights) to predict body composition metrics from 2D frontal and lateral projection images generated from 3D MRI scans, with DXA scans serving as ground truth. The model fused image features with participant sex, height, weight, and internal BMI through a final dense layer to output probability density functions for target metrics. - Fine-tuning (PhotoBIA cohort, N = 677): With the PhotoBIA dataset
[d7d94d] , we fine-tuned the model using real-world smartphone photos paired with DXA ground truth with 5-fold cross-validation. To augment training data, an automated landmark detection pipeline selected optimal frontal and lateral pose frames directly from 360-degree participant videos. - Validation (MetabolicMosaic cohort, N = 132): Evaluated on an independent cohort
[294b87] , PhotoScan achieved strong DXA agreement across BF%, A/G ratio and V/S ratio, enabling near-DXA accuracy for predicting insulin resistance. This independent validation dataset came from a 30-week longitudinal trial in San Francisco, participants had complete paired data across DXA, PhotoScan, BIA, anthropometrics, 12-hour fasting blood labs (fasting glucose and insulin, full lipid panel, etc.), and passive continuous Fitbit tracking.
Key results
Body composition accuracy
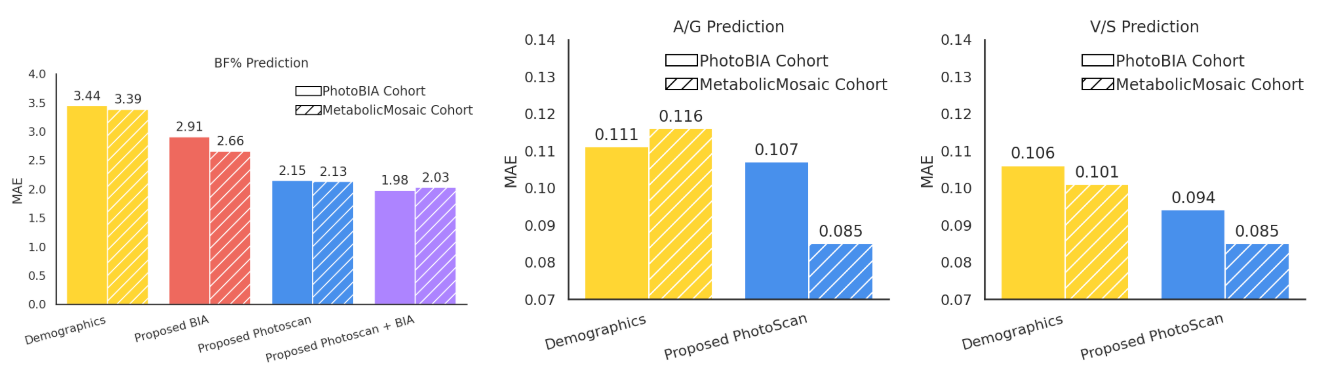
For the PhotoBIA Cohort, evaluated via the 5 fold cross-validation, the fine-tuned PhotoScan model demonstrated an average mean absolute error (MAE) of 2.15 for BF% prediction across the PhotoBIA cohort, while the BIA-based model achieved an MAE of 2.91. The averaged MAE is 0.107 for A/G and 0.094 for V/S. For the MetabolicMosaic cohort (independent validation), the MAE of BF%, A/G and V/S are all comparable with the PhotoBIA Cohort (2.13 for BF%, 0.085 for A/G and 0.085 for V/S). Overall, the fine-tuned PhotoScan models demonstrated strong consistency between the fine-tuning and validation datasets. The minor reduction in A/G and V/S observed in the MetabolicMosaic cohort is driven by its higher proportion of female records (67%) than the PhotoBIA cohort (57%), as females generally exhibit lower absolute A/G and V/S ratios due to predominantly gynoid, subcutaneous fat storage, which reduces regional ratio variance and the prediction error.
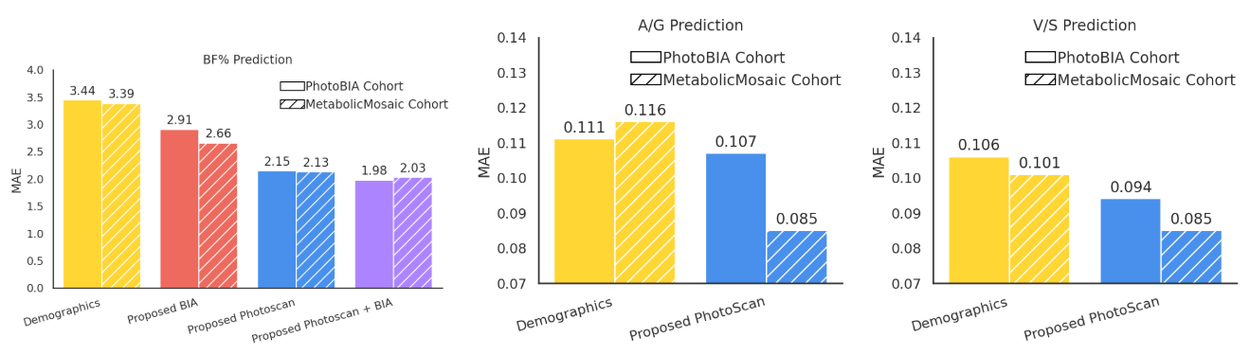
PhotoScan demonstrates consistent performance in predicting BF%, A/G and V/S across independent cohorts.
Insulin resistance classification
Next, we compared how well different combinations of data predicted insulin resistance, stacking our baseline demographics against combining it with standard tape measurements, smartwatch BIA sensors, PhotoScan, and gold-standard DXA scans.
We tested our models on the MetabolicMosaic cohort using a gradient boosting classifier to identify subjects with insulin resistance. To ensure our results were completely unbiased and leak-free, we implemented a rigorous testing process that repeatedly evaluated the model on unseen data. We also made sure each test group was evenly balanced by both BMI and insulin resistance status, ensuring a fair and realistic performance test. With this robust framework in place, we systematically fed the classifier five distinct feature sets to compare their predictive power, baseline demographics like age, sex, and body mass index, standard tape measure anthropometrics, smartwatch bioelectrical impedance, our smartphone PhotoScan metrics, and the clinical gold-standard DXA scans. By comparing how the model performed with each of these isolated inputs, we established the clinical value of our smartphone optical phenotyping.
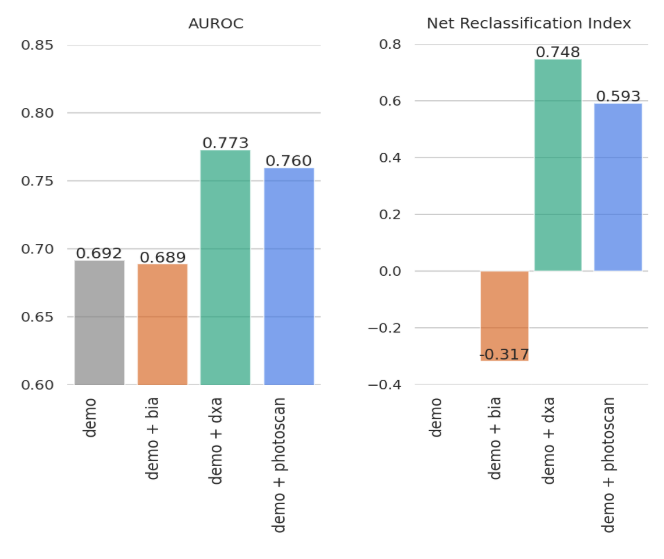
To evaluate our models, we focused on two key metrics: the Area Under the Receiver Operating Characteristic curve (AUROC) and the Net Reclassification Index (NRI). Simply put, AUROC measures how accurately a model can distinguish between someone who has insulin resistance and someone who does not (higher is better). NRI, on the other hand, quantifies exactly how much our new digital metrics improve our ability to correctly categorize people compared to our old baseline model. As the figure below indicates, our baseline demographic model achieved an AUROC of 0.692. When we added the photoscan-based body composition features (demo + photoscan), the classification accuracy improved to an AUROC to 0.760 and NRI improved to 0.593, nearly as effective as using clinical DXA data itself, which topped out at an AUROC of 0.773 and an NRI of 0.748. In contrast, adding BIA with demographics (demo + bia below) yielded no improvement in AUROC or NRI for insulin resistance classification for IR classification, as BIA only provides BF% estimation, whose feature importance is significantly lower than A/G ratio and V/S ratio in the demo + photoscan model.
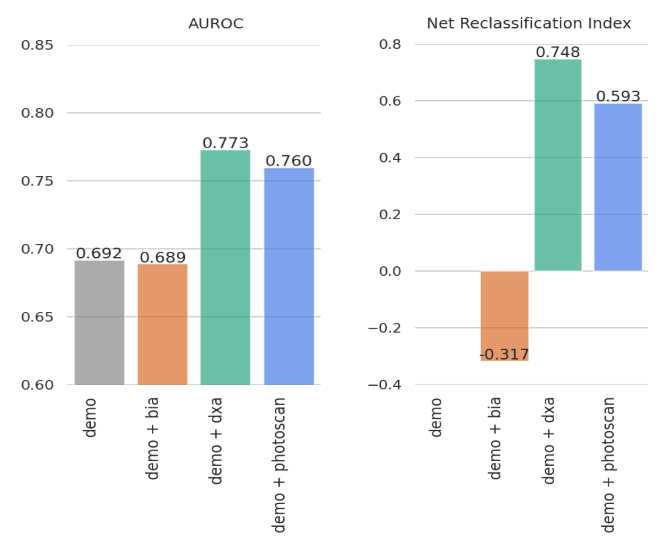
AUROC and NRI comparison of the demographics (baseline) model, demographics plus BIA (demo + bia) model, demographics plus DXA (demo + dxa) model and demographics plus PhotoScan (demo + photoscan) model.
Conclusions and future directions
Overall, our findings demonstrate the feasibility of smartphone-based body composition estimation as a scalable tool for cardiometabolic research. Clinical DXA imaging delivers the most accurate body composition but lacks scalability, whereas wearable BIA sensors offer convenience but are limited to basic body fat percentage. Our PhotoScan approach offers a promising middle ground, estimating granular body composition from standard smartphone imagery with near-DXA accuracy.
Ultimately, this research highlights how digital phenotyping can address key limitations of traditional anthropometrics like BMI, which often miss clinically significant variations in body composition. Our study demonstrates that optical body composition estimation from smartphone imagery is both technically feasible and clinically informative. While still a research prototype, this approach suggests a path toward accessible, non-invasive screening for insulin resistance risk.
While these results are encouraging, body composition is just one component of cardiometabolic health. Looking ahead, our research aims to explore multi-modal data integration, combining body composition estimation with continuous wearable data, glucose dynamics, and clinical blood biomarkers. By bringing these diverse signals together, we hope to support more holistic, accessible approaches to managing personal metabolic health.
Quick links
Other posts of interest
-

October 16, 2026
Grounding AI agents in biological reality: Building blocks for autonomous wet labs- General Science ·
- Health & Bioscience ·
- Robotics
-

October 14, 2026
Research@ 2026: 10 ways we're amplifying human ingenuity- General Science ·
- Generative AI ·
- Health & Bioscience
-

October 14, 2026
Analyzing technical documents with Deep Review- General Science ·
- Machine Intelligence ·
- Natural Language Processing