Ten years of neuroscience at Google yields maps of human brain
May 2, 2024
Viren Jain, Research Scientist and Technical Lead, Connectomics at Google
Marking ten years of connectomics research at Google, we are releasing a publication in Science about a reconstruction at the synaptic level of a small piece of the human brain. We discuss the reconstruction process and dataset, and we present several new neuron structures discovered in the data.
Quick links
The human brain uses no more power than a dim incandescent light bulb, yet it can accomplish feats still not possible with the largest artificial computing systems. To understand how requires a level of understanding more profound than knowing what part of the brain is responsible for what function. The field of connectomics aims to achieve this by precisely mapping how each cell is connected to others. Building detailed maps of how brains from many types of organisms are wired is transforming our understanding of how brains work. This could help researchers understand neurological disorders and also answer fundamental questions, such as how memories form.
This year marks the tenth anniversary of the formation of Google Research’s Connectomics research team. We have made connectomes possible through the development of machine learning (ML) algorithms and software tools that process and visualize data at unprecedented scale. Marking this anniversary, today we publish in Science, “A petavoxel fragment of human cerebral cortex reconstructed at nanoscale resolution” in collaboration with Jeff Lichtman of Harvard University and others. Released previously as a preprint, this connectome describes a piece of human brain tissue the size of half a grain of rice that nonetheless requires 1.4 petabytes (1.4 million gigabytes) to encode — including about 16,000 neurons, 32,000 glia, 8,000 blood vessel cells (for a total of ~57,000 cells) and 150 million synapses. This project revealed never-before-seen structures within the human brain that may change our understanding of how our brains work.
 |
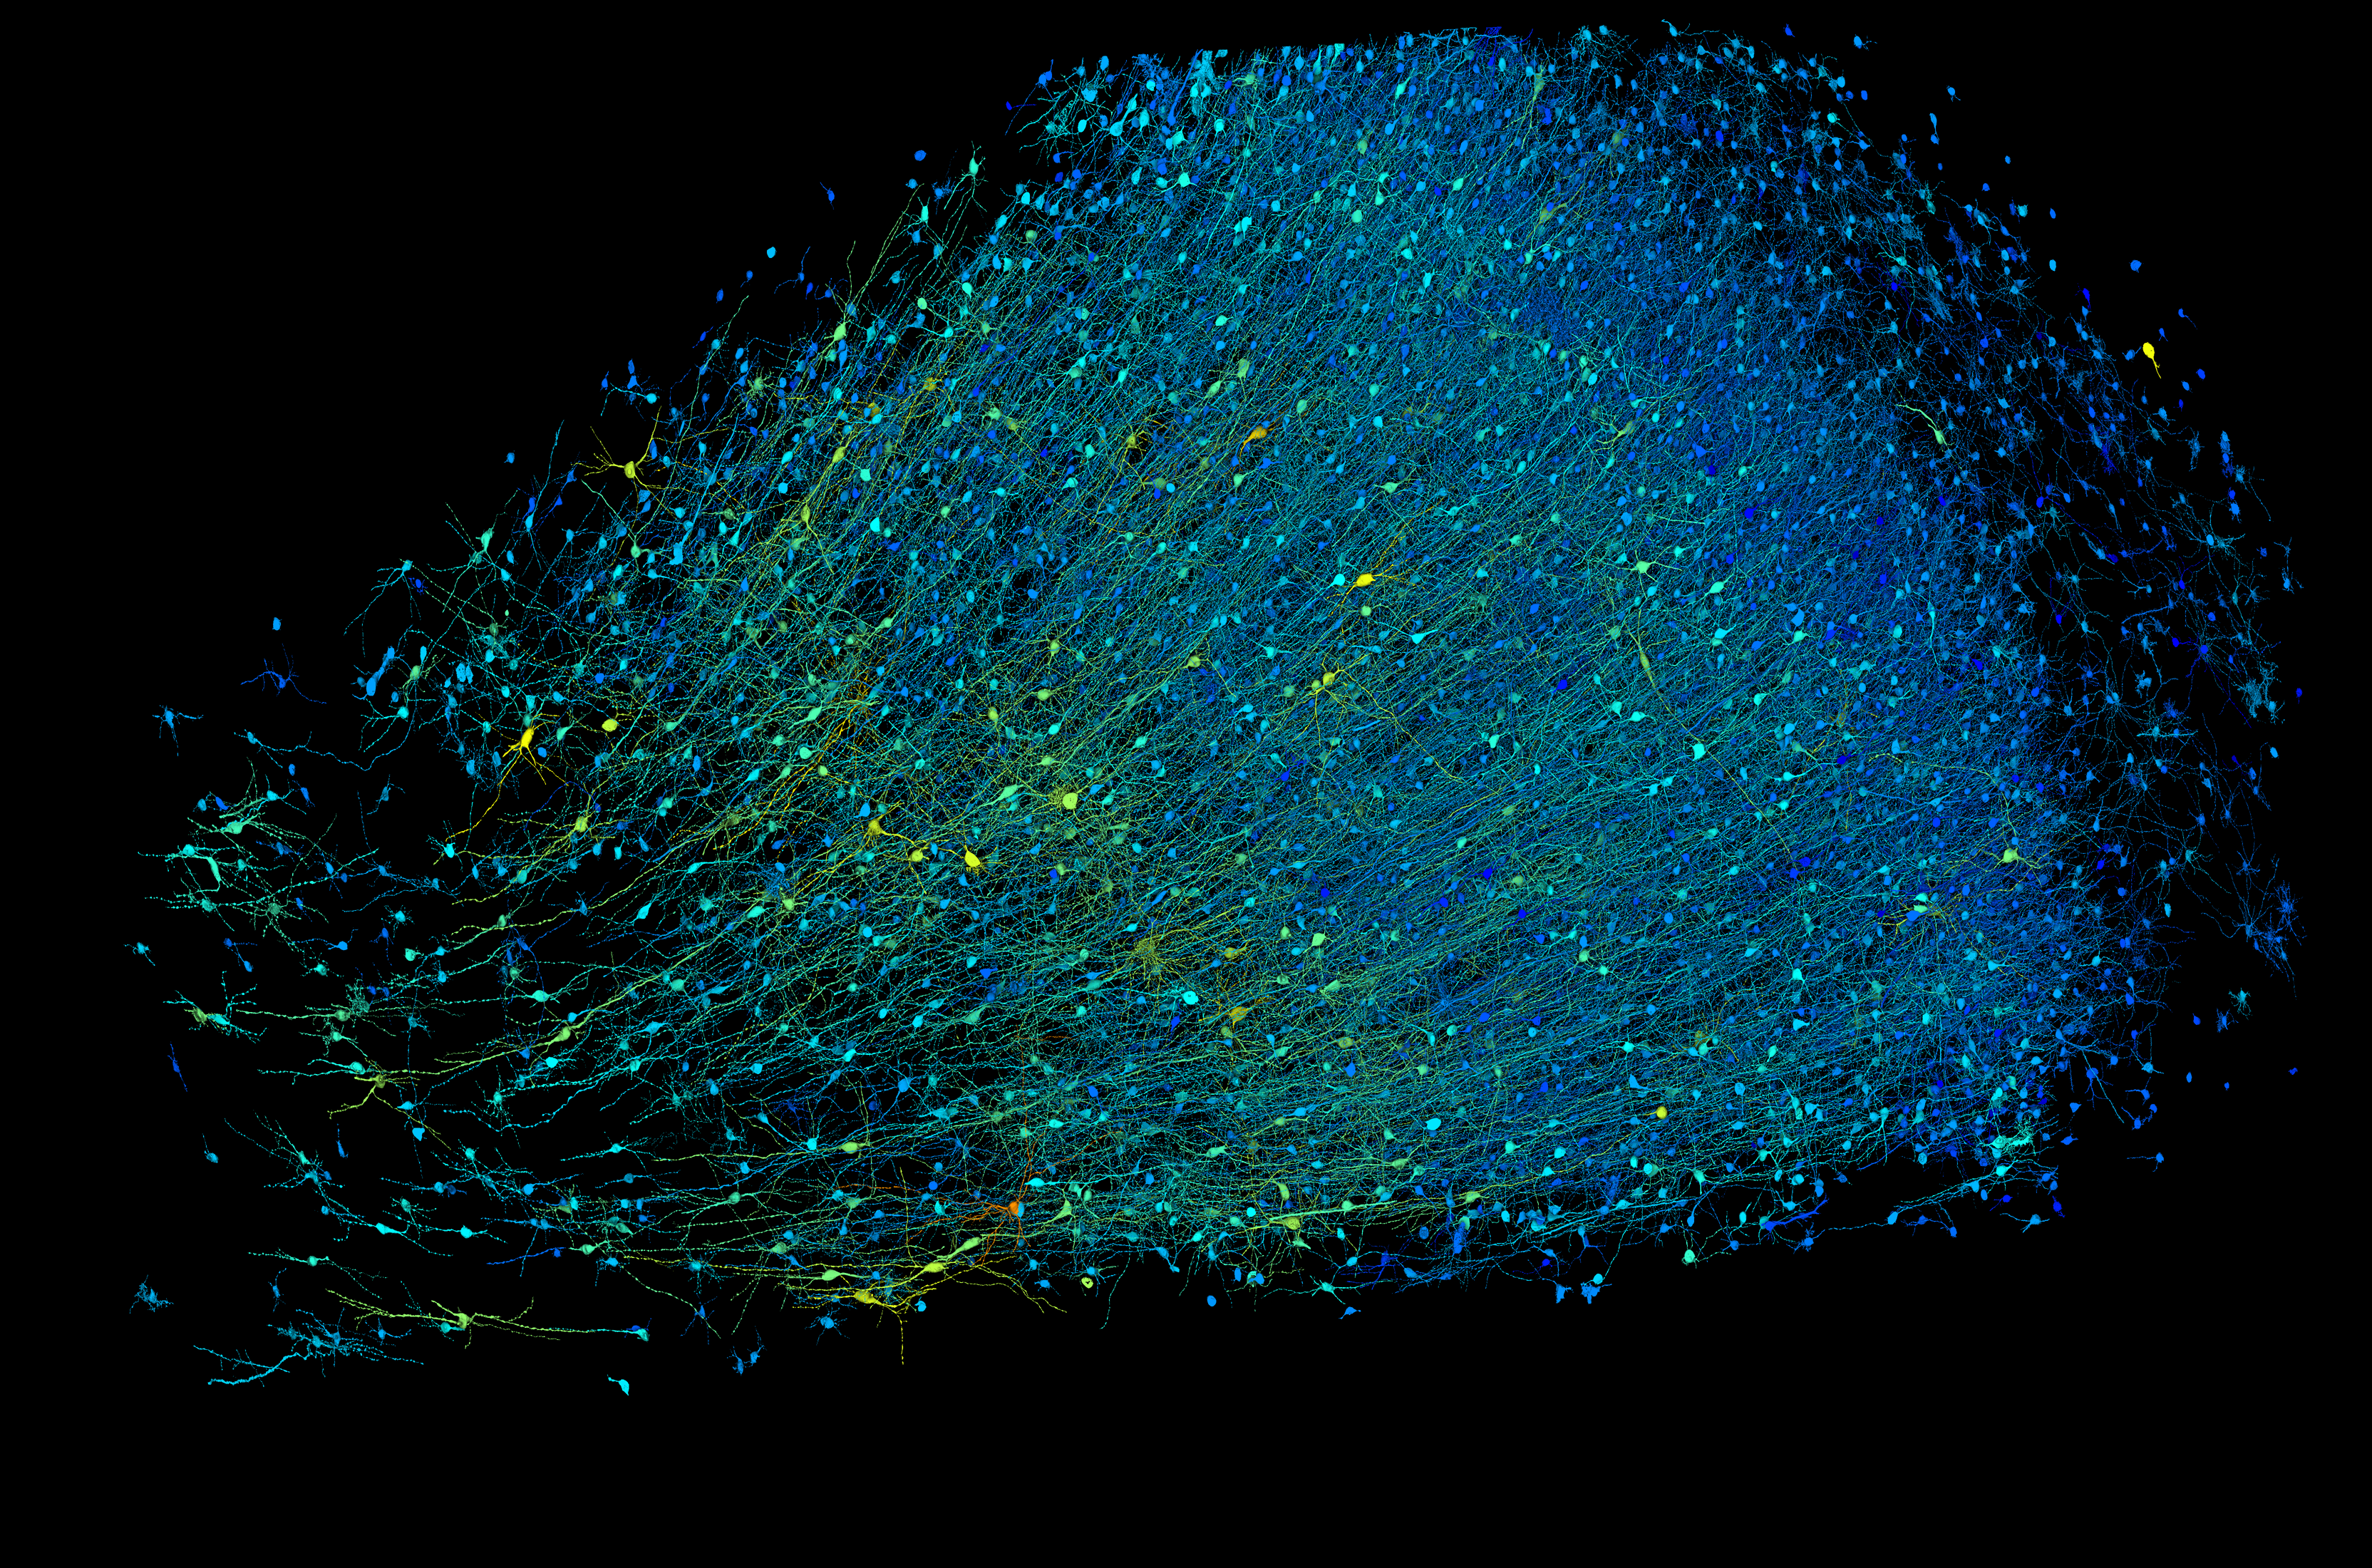 |
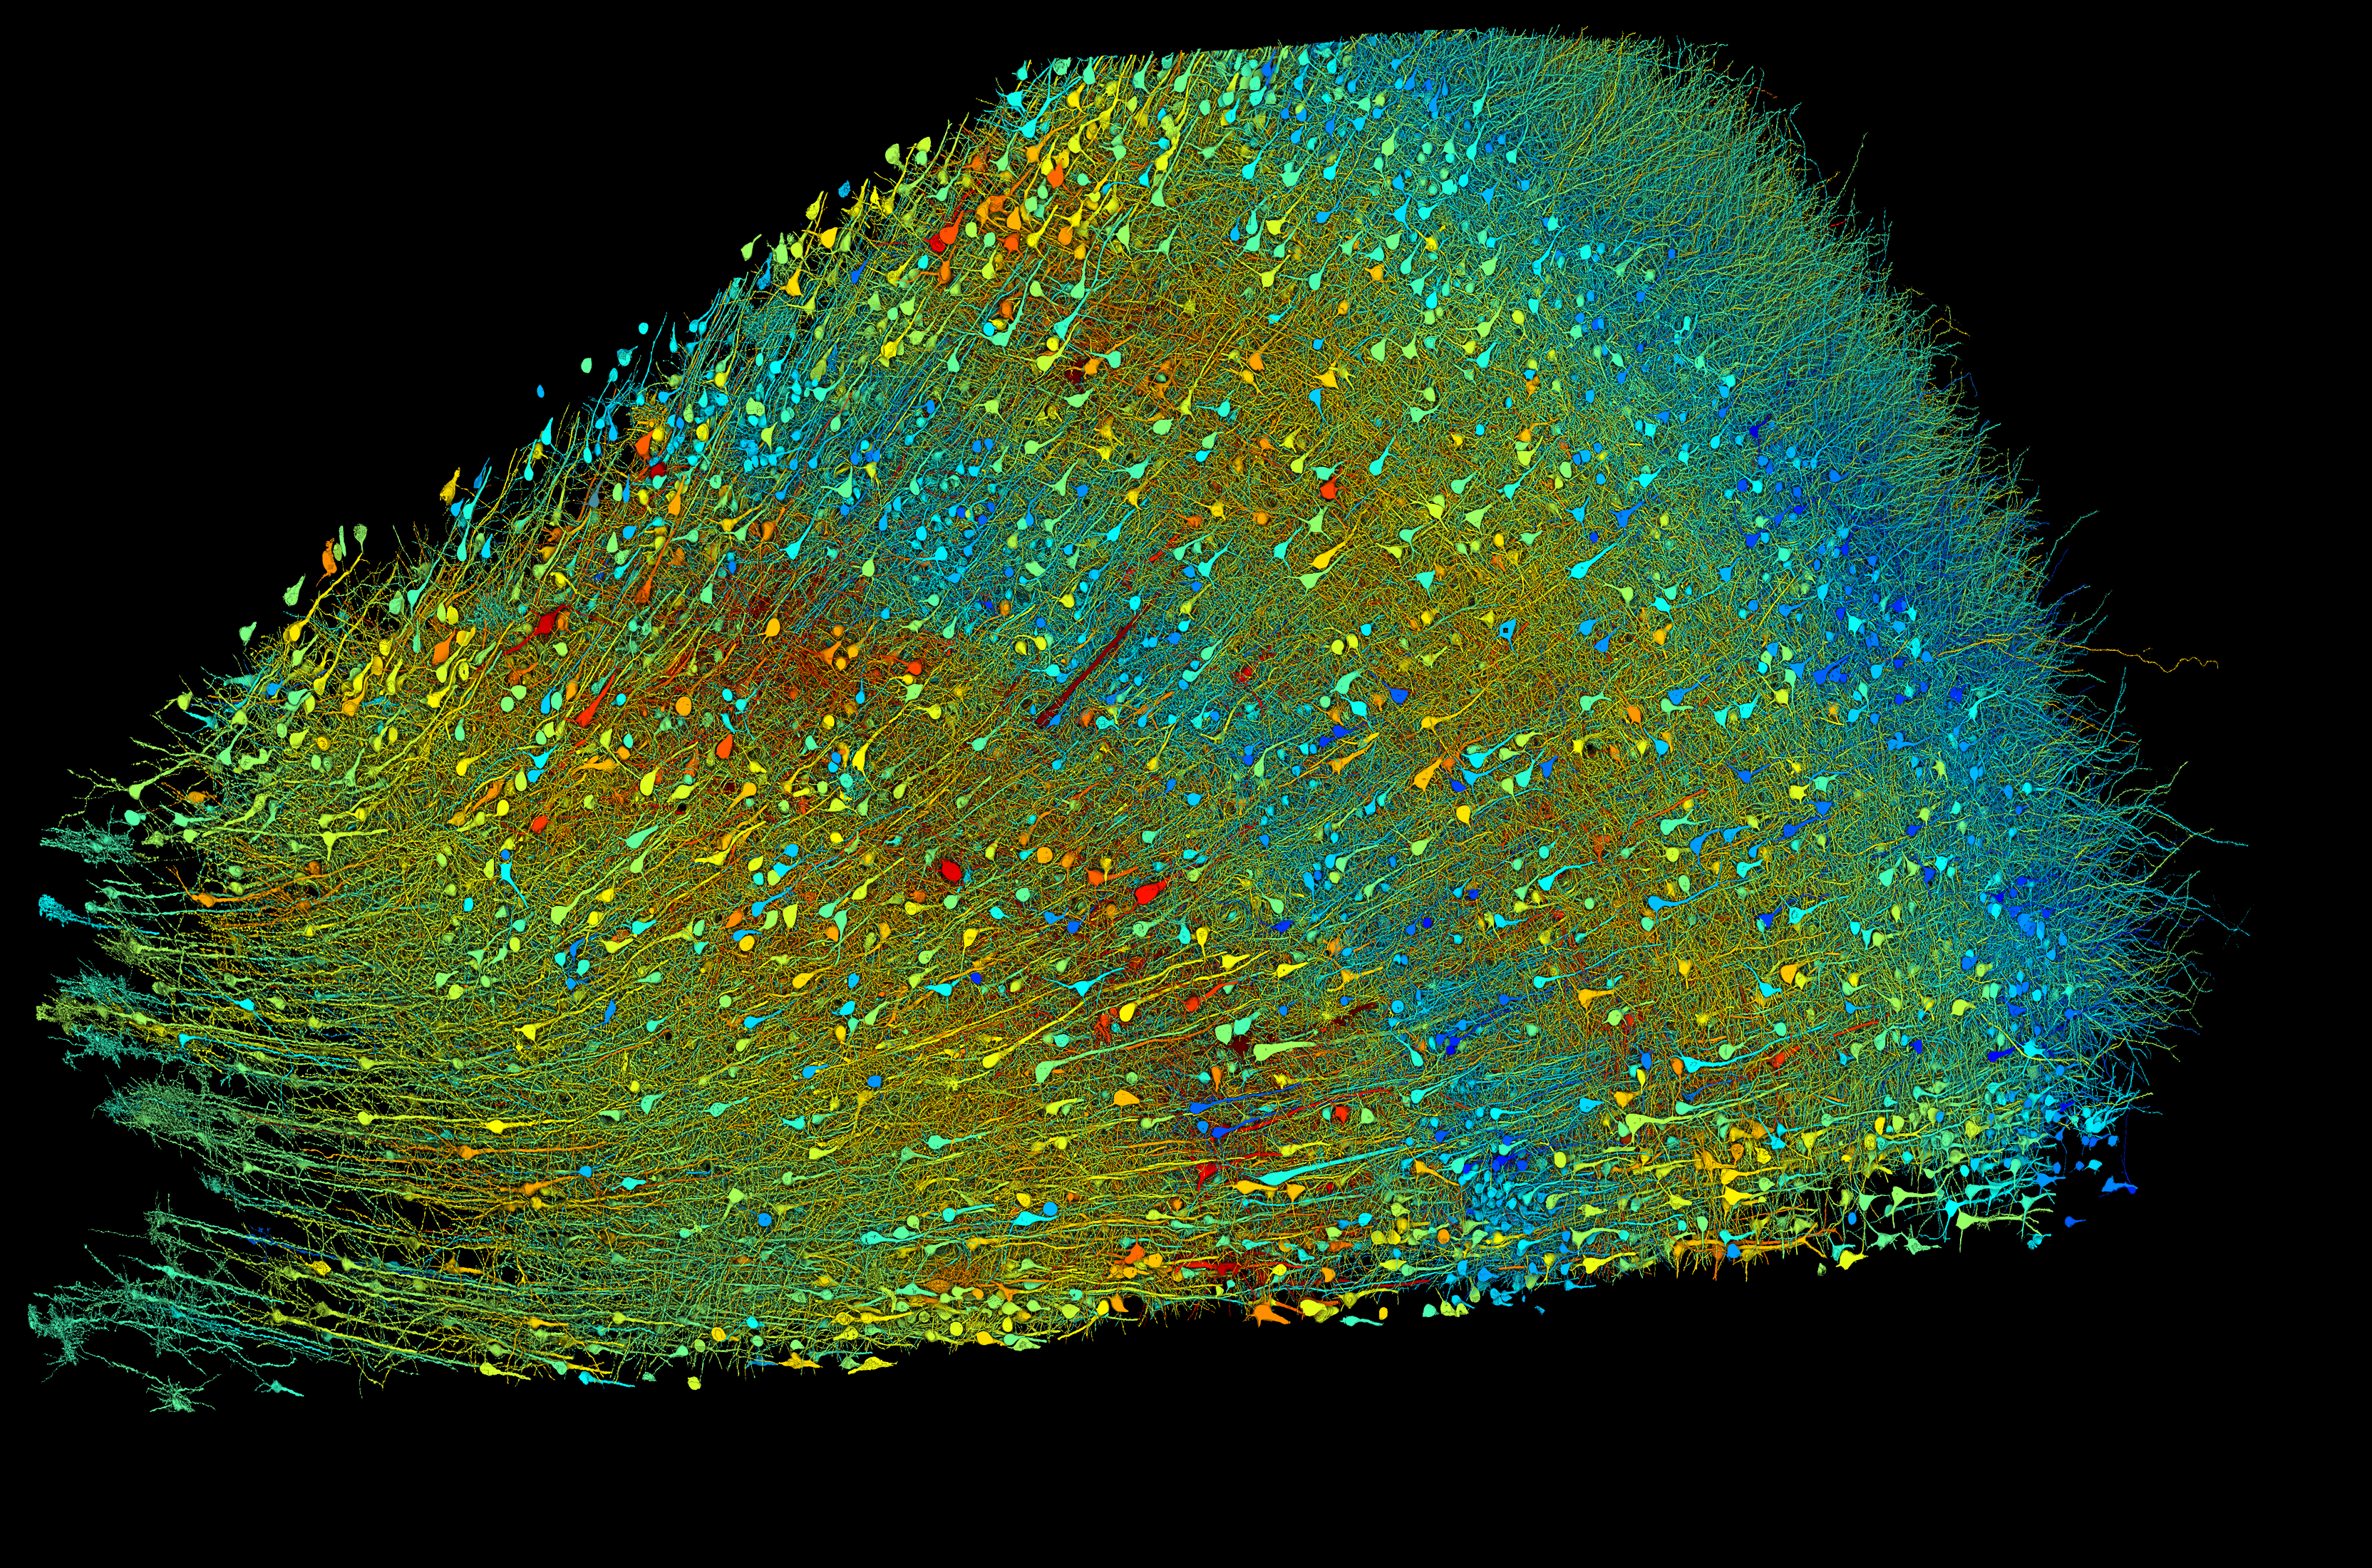
| Researchers built a 3D image of nearly every neuron and their connections within a small piece of human brain tissue. The left image shows excitatory neurons and the right image shows inhibitory neurons. These versions are shaded according to the size of the neurons’ cell bodies (central core), which range from 15–30 micrometers across. The sample is approximately 3 mm wide. Credit: Google Research & Lichtman Lab (Harvard University). Renderings by D. Berger (Harvard University). |
Since we published the preprint, we have expanded our suite of interactive, open source tools that enable researchers to investigate the dataset on their own. The ability for other researchers to proofread and refine this human brain connectome is one of many ways that we see the release of this paper and the associated tools as not only the culmination of 10 years of work, but the beginning of something new.
Scaling brain science
The first connectome was published in 1986 — before AI tools existed — for the 302 neurons in the nematode model organism Caenorhabditis elegans. It took 16 years to create it from cross-sectional microscope images of the worm. Researchers manually colored in cells from one cross-section to another to visualize the connections in this simple nervous system.
When the Connectomics team at Google launched ten years ago, we were excited about how innovations in AI and working with large datasets could enable us to move from 302 neurons to the tens of thousands or millions found in more complex organisms. Our work required novel algorithms capable of handling the tremendous amounts of data — now petabytes — these studies generate. We developed flood-filling networks to replace the manual effort of coloring in cells across images. These networks allow automated reconstruction of neurons through layers of tissue. Building on this, our SegCLR algorithm automatically identifies distinct parts of cells and cell types within these networks. We also developed TensorStore, an open-source C++ and Python software library to store and manage massive multi-dimensional datasets. This tool has realized benefits well beyond connectomics and is now widely used at Google and across the broader ML community.
We first demonstrated these algorithms when we released the connectome for the “hemibrain” of the fruit fly Drosophila melanogaster in 2020. Revealing the connections among 25,000 neurons in a central portion of the fruit fly brain, this reconstruction has been used by other researchers to make findings about learning, memory, and behavior in the fruit fly. Groups have since published hundreds of papers that build on the fruit fly connectome.
Through collaborations with researchers at the Howard Hughes Medical Institute, Harvard University, and Max Planck Institute we have also published connectomes for portions of the brains of the zebra finch and zebra fish larvae.
In the work published today, our team reports a new milestone: a synaptic-resolution reconstruction of a 1 cubic mm piece of human brain tissue. Our collaborators generated the dataset using a sample of brain tissue from the left anterior temporal lobe that was removed during brain surgery on a person with epilepsy. Lichtman’s team used a multibeam scanning electron microscope to gather high resolution images of more than 5,000 slices of tissue, each roughly 30 nanometers thick. Image acquisition alone took 326 days. Then our team’s tools stitched and aligned the image data, reconstructed the three dimensional structure of each cell, including its axons and dendrites, identified synaptic connections, and classified cell types. The reconstruction revealed several surprises.
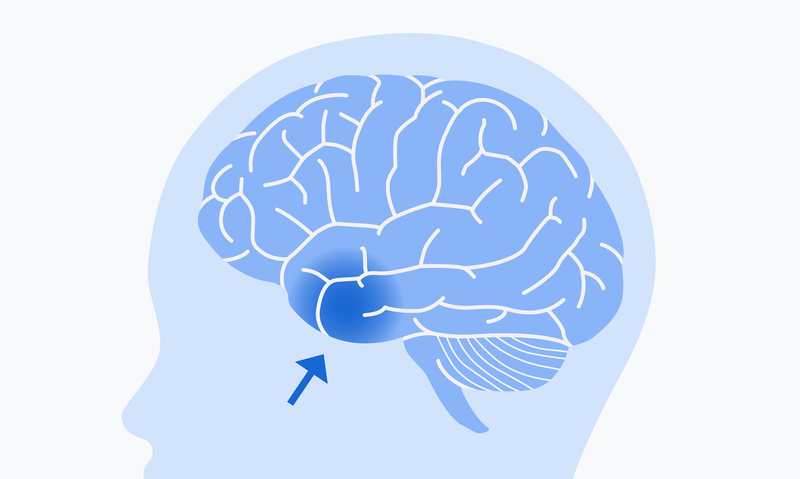
The brain tissue sample used in this research came from the left anterior temporal lobe.
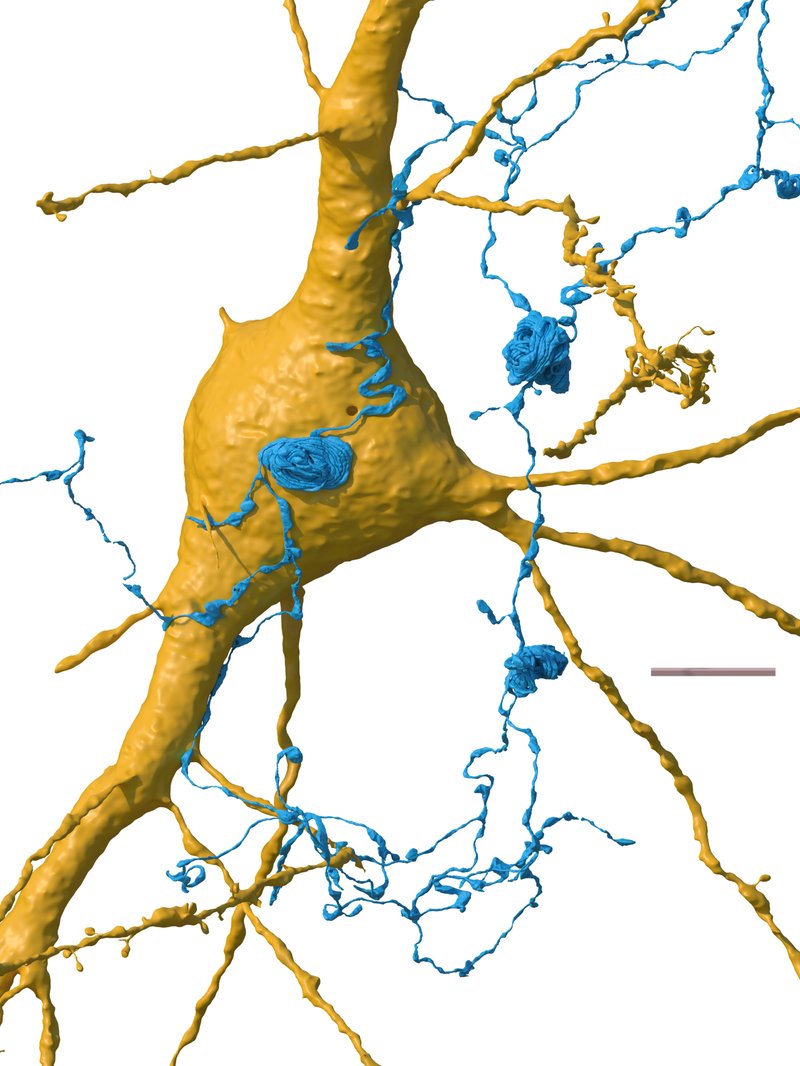
For example, we found a class of rare but extremely powerful synaptic connections in which a pair of neurons may be connected by more than 50 individual synapses. While 96.5% of contacts between axons and their target cells have just one synapse, 0.092% have four or more synaptic connections. The conformation of these connections combined with refined statistical analysis that is part of the Science publication suggests that these powerful connections are not the result of chance, but rather that these pairs had a reason to be more strongly connected than is typical. Further study of these connections could reveal their functional role in the brain. Perhaps, for example, these strong connections are how the brain achieves particularly fast neural responses or how it encodes very important memories.
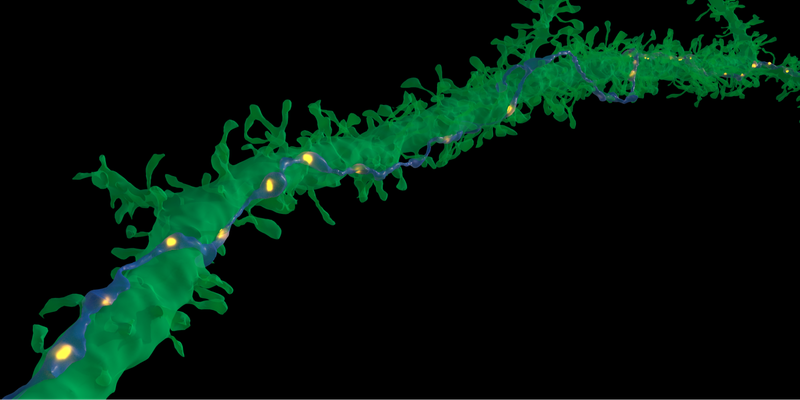
In very rare cases, a single axon (blue) made repeated synaptic connections (yellow) with a target neuron (green). The purpose of these very tight connections is not yet known. Credit: Google Research & Lichtman Lab (Harvard University). Renderings by D. Berger (Harvard University).
We also observed a curious mirror symmetry in the deepest layer of the cortex, which has to-date been the least-studied layer. This layer contains so-called triangular neurons that have one basal dendrite much larger than the others. Among these neurons, 77 percent fell into one of two categories: those whose large basal dendrite tilted toward one edge of the sample and those whose large basal dendrite tilted toward the other edge at the mirror-symmetrical angle. Our statistical analysis showed that those with one type of tilt tended to be next to others with the same type of tilt more than would be expected by chance. The statistical correlation in these mirrored neurons suggests there may be some underlying function at play, but we don’t yet know what that might be. We present one particularly symmetric pair here.
The deepest layer of the cortex contains clusters of cells that tend to occur in mirror-image orientation to one another. This image shows a particularly symmetric pair. Credit: Google Research & Lichtman Lab (Harvard University). Renderings by D. Berger (Harvard University).
Another oddity was the appearance of “axon whorls”, which are beautiful but mysterious structures in which an axon wraps itself into complicated knots. These were rare in the sample and sometimes occurred on the surface of another cell. Similarly, we do not know what these do.
Axons (blue) are the filamentous part of a nerve cell that carries a signal away from the cell. Researchers found never-before-seen “axon whorls” in the sample, sometimes on the surface of another nerve cell (yellow). Credit: Google Research & Lichtman Lab (Harvard University). Renderings by D. Berger (Harvard University).
The fact that the brain tissue sample comes from someone with epilepsy raises the question of whether these unusual features are connected to the disease or to pharmaceuticals taken to treat it, rather than being common to human brains. Although there was no substantial indication of pathology from looking at the sample with a light microscope, this possibility can’t be ruled out. Repeating this analysis for other tissue samples that result from the treatment of other disorders could help to put this sample’s findings in context.
Given the scale and complexity of the dataset, we expect that there are many other novel structures and characteristics yet to be discovered. These findings are the tip of the iceberg of what we expect connectomics will tell us about human brains.
Collaborative tools
The central collaborative tool for interacting with the brain tissue data is Neuroglancer, a browser-based platform — originally created for our reconstruction of the fruit fly brain — that allows users to explore the dataset, including the AI-generated annotations of cell type for each cell.
Another key tool is CAVE, which was developed by researchers at Princeton and the Allen Institute as an extension of Neuroglancer and allows users to proofread and update the annotated data to improve the dataset as a part of their own research. Researchers can select particular neurons or their connections and manually refine and annotate their reconstructions. CAVE has been available for smaller datasets including the fly connectome, but in this work we updated the algorithms to be able to handle a dataset of this size. The proofreading that this interface allows is a key final step in completing the connectome reconstruction.
Our hope is that the new Science paper will encourage other researchers to use the data to make additional discoveries about this part of the human brain. We are pleased that this is already happening. The preprint has been downloaded over 30,000 times and has been cited in over 200 papers. These include a recent study in Neuron that analyzed how tiny “cilia” attached to brain cells found in the dataset may play an important role in the functional organization of the human cortex, and a computational investigation into how the shape of the neurons relates to other properties of human cortex organization. The interactive viewer of the dataset has been accessed over 100,000 times.
Future directions
Looking ahead, we are working to scale connectomics to the hippocampus of the mouse with partners at Harvard, Princeton, and elsewhere. Our team and partners at the Institute of Science and Technology Austria have also recently proposed a method for connectomic mapping using light microscopes that could make it much easier to collect images for connectomic analysis. The team has also begun more intensive study of tissue associated with neurological diseases, such as Alzheimer’s disease, in order to better understand the potential structural changes associated with these devastating conditions.
Acknowledgements
We thank our long-term academic collaborators in the Lichtman Lab (Harvard University), and acknowledge core contributions from the Connectomics Team at Google. We are grateful to Elise Kleeman and Jessica Marshall for their help. Thanks to Lizzie Dorfman, Michael Brenner, John Platt, Jay Yagnik and Jeff Dean for their support, coordination and leadership.
Quick links
Other posts of interest
-
June 1, 2021
A Browsable Petascale Reconstruction of the Human Cortex -

July 16, 2018
Improving Connectomics by an Order of Magnitude- Machine Intelligence ·
- Machine Perception
-
September 22, 2022
TensorStore for High-Performance, Scalable Array Storage- Distributed Systems & Parallel Computing ·
- Open Source Models & Datasets